
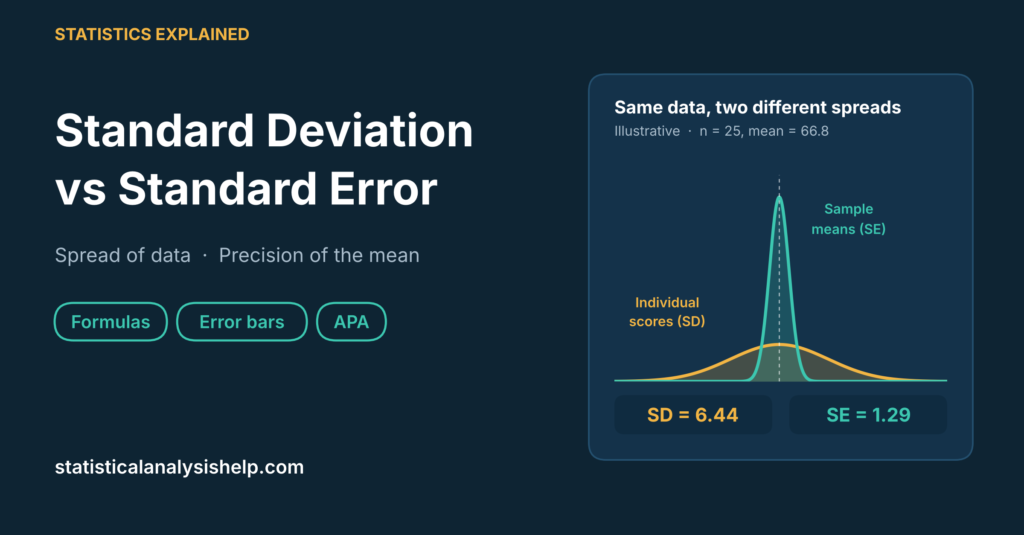
The key difference in standard deviation vs standard error is what each one describes. The standard deviation (SD) describes how spread out individual values are around the mean. The standard error (SE) describes how precisely your sample mean estimates the population mean. SD stays roughly the same as your sample grows, while SE gets smaller.
This guide explains both measures in plain language, shows the formulas, works through one example from start to finish, and sets out clear rules for which one to report in tables, text and graphs. You will also see how to calculate both in SPSS, R, Python and Excel.
Standard Deviation vs Standard Error: The Key Difference
Think of a class of students taking a test. The standard deviation tells you how much the individual scores vary from student to student. The standard error tells you how much the class average would vary if you could repeat the test with many different samples of students.
Table 1. Standard Deviation vs Standard Error at a Glance
| Feature | Standard deviation (SD) | Standard error (SE) |
|---|---|---|
| What it measures | Spread of individual values | Precision of a sample estimate, such as the mean |
| Formula (for the mean) | s = √[Σ(x − x̄)² / (n − 1)] | SE = s /√n |
| Describes | Your data | Your estimate |
| Effect of a larger sample | Stays about the same | Gets smaller |
| Typical use | Describing a sample in a results table | Confidence intervals and hypothesis tests |
| How to report | Mean (SD), for example 66.8 (6.44) | SE or, preferably, a 95% confidence interval |
| Example value (n = 25) | 6.44 | 1.29 |
If you are unsure which values your results tables should show, our statistical analysis help starts with a free initial consultation about your data and reporting requirements.
What Is Standard Deviation?
The standard deviation measures the typical distance between individual values and the mean. A small SD means most values sit close to the mean; a large SD means they are widely spread.
When data are roughly normally distributed, the SD has a useful rule of thumb: about 68% of values fall within one SD of the mean and about 95% within two SDs. This rule only holds approximately, and only for data that are close to normal. Our guide on how to test for normality shows how to check this.
The SD is also sensitive to extreme values. A single outlier can inflate it noticeably, so it is worth reviewing how to deal with outliers in data analysis before you report it.
What Is Standard Error?
The standard error measures how much a sample statistic would vary from sample to sample if you repeated your study many times. It is the standard deviation of the statistic’s sampling distribution.
Most people mean the standard error of the mean (SEM) when they say “standard error”. It tells you how precisely your sample mean estimates the population mean. A small SE means your estimate is precise; a large SE means it could be some distance from the true population value.
Other statistics have their own standard errors too, such as a difference between two means, a proportion or a regression coefficient. These are covered briefly later in this guide.
Formulas for Standard Deviation and Standard Error
Sample standard deviation:
s = √[ Σ(x − x̄)² ÷ (n − 1) ]
Here x is each value, x̄ is the sample mean and n is the sample size. Dividing by n − 1 rather than n (Bessel’s correction) gives a better estimate of the population SD from a sample. Most software reports this sample SD by default. In Excel, STDEV.S uses n − 1, while STDEV.P uses N and is meant for a complete population.
Standard error of the mean:
SE = s ÷ √n
Because the sample size appears under a square root in the denominator, the SE shrinks as n grows. Quadrupling the sample size halves the standard error.
Worked Example: Calculating SD and SE Step by Step
A researcher measures a wellbeing score (0–100) for 25 participants. The data are illustrative:
62, 71, 58, 66, 74, 69, 55, 80, 63, 67, 72, 60, 65, 70, 59, 76, 68, 64, 73, 61, 66, 70, 57, 75, 69
Step 1: Calculate the mean. The scores add up to 1,670, so the mean is 1,670 ÷ 25 = 66.8.
Step 2: Calculate the standard deviation. Subtract the mean from each score, square the differences, add them up, divide by n − 1 = 24 and take the square root. This gives SD = 6.44.
Step 3: Calculate the standard error. SE = 6.44 ÷ √25 = 6.44 ÷ 5 = 1.29.
What the two numbers mean:
- SD = 6.44 describes the participants. If the scores are roughly normal, about 68% of people score between about 60.4 and 73.2, and about 95% between about 53.9 and 79.7.
- SE = 1.29 describes the estimate. If you repeated the study many times with new samples of 25 people, the sample means would typically vary by about 1.29 points around the true population mean.
The SE is much smaller than the SD because averaging 25 scores cancels out much of the individual variation.
How Sample Size Affects Standard Deviation and Standard Error
The clearest way to see the difference is to change the sample size. Suppose a population has a standard deviation of about 10.
Table 2. How Sample Size Affects SD and SE
| Sample size (n) | Expected SD | SE of the mean | 95% CI half-width (approx.) |
|---|---|---|---|
| 25 | about 10 | 10 ÷ 5 = 2.0 | ± 4.13 |
| 100 | about 10 | 10 ÷ 10 = 1.0 | ± 1.98 |
| 400 | about 10 | 10 ÷ 20 = 0.5 | ± 0.98 |
The SD stays around 10 because it estimates the spread in the population, which does not change when you collect more data. The SE falls in proportion to 1 ÷ √n, so each time the sample size quadruples, the SE halves and the confidence interval becomes about half as wide. This is why larger studies give more precise estimates, even though individuals are just as varied as before.
Standard Error and Confidence Intervals
The standard error is the building block of confidence intervals and many hypothesis tests. For a mean, a 95% confidence interval is:
95% CI = mean ± t × SE
Here t comes from the t distribution with n − 1 degrees of freedom. For large samples, t is close to 1.96.
For the worked example, t with 24 degrees of freedom is 2.064, so the 95% CI is 66.8 ± 2.064 × 1.288 = 64.14 to 69.46. In plain terms, the data are consistent with a population mean wellbeing score anywhere in that range.
Standard errors also sit behind test statistics such as t: a t value is an estimate divided by its standard error. For more on the logic of testing, see our guide to null vs alternative hypotheses, and for help applying it to your own analysis, our inferential statistics help can support you.
When to Report Standard Deviation vs Standard Error
A simple rule covers most situations: use the SD to describe your data, and use the SE, or better a confidence interval, to describe the precision of an estimate.
- Describing a sample (for example, participant characteristics or scale scores in a descriptive table): report the mean and SD.
- Describing an estimate (for example, how precisely you have estimated a population mean or a group difference): report a 95% confidence interval, or the SE if your field or journal asks for it.
- Inferential results (t tests, ANOVA, regression): report the test statistic, p value and effect size, with confidence intervals where possible.
Reporting “mean ± SE” to describe how varied a sample is can be misleading, because the SE is always smaller than the SD and makes the data look less variable than they are.
APA 7 examples (illustrative):
Participants’ wellbeing scores averaged 66.8 (SD = 6.44).
The mean wellbeing score was 66.8, 95% CI [64.1, 69.5].
For full reporting examples, see how to report t-test results in APA style and how to report ANOVA results in APA style. If you are building descriptive and inferential tables for a full results chapter, our guide on how to write Chapter 4 results and discussion helps you structure it, and working with a dissertation statistician can make sure every table reports the right measure.
SD, SE or Confidence Interval Error Bars?
Error bars on graphs are one of the most common places where SD and SE get mixed up. Whatever you choose, always state in the figure caption which measure the bars show.
- SD bars show how spread out the individual values are. Use them when the purpose of the graph is to describe variability.
- SE bars show the precision of each mean. They are much shorter than SD bars, which can make variability look smaller than it is.
- 95% confidence interval bars show a range of plausible values for each mean. They are usually the best choice when the graph is meant to support comparisons or conclusions.
Be careful with visual rules of thumb. Non-overlapping SE bars do not by themselves prove a statistically significant difference, and two 95% CI bars can overlap slightly while the difference between independent groups is still significant. These overlap rules also do not apply to repeated-measures designs. Base conclusions on the appropriate test, not on how the bars look. If you are unsure how to test the differences shown in your graphs, our help with hypothesis testing can guide you.
Not sure whether your tables and graphs should show SD, SE or confidence intervals? Send us your output for a review. Request Quote Now.
How to Calculate SD and SE in SPSS, R, Python and Excel
Table 3. How to Get SD and SE in SPSS, R, Python and Excel
| Software | Standard deviation | Standard error of the mean | 95% CI |
|---|---|---|---|
| SPSS | Analyze > Descriptive Statistics > Descriptives > Options > Std. deviation | Same dialog > S.E. mean | Analyze > Descriptive Statistics > Explore |
| R | sd(x) |
sd(x) / sqrt(length(x)) |
t.test(x)$conf.int |
| Python | x.std(ddof=1) |
scipy.stats.sem(x) |
scipy.stats.t.interval() |
| Excel | =STDEV.S(range) |
=STDEV.S(range)/SQRT(COUNT(range)) |
Mean ± CONFIDENCE.T(0.05, STDEV.S(range), COUNT(range)) |
SPSS
Go to Analyze > Descriptive Statistics > Descriptives, move your variable across, click Options and tick Std. deviation and S.E. mean. The Explore procedure also reports the standard error and a 95% confidence interval for the mean. Our guide on how to interpret SPSS output explains these tables, and our SPSS analysis help can run and check them for you.
R
x <- c(62, 71, 58, 66, 74, 69, 55, 80, 63, 67, 72, 60, 65,
       70, 59, 76, 68, 64, 73, 61, 66, 70, 57, 75, 69)
mean(x)                    # 66.8
sd(x)                      # 6.44 (uses n - 1)
sd(x) / sqrt(length(x))    # 1.29
t.test(x)$conf.int         # 64.14 to 69.46
If you are working in R for a course or thesis, our RStudio help covers code and output.
Python
import numpy as np
from scipy import stats

x = np.array([62, 71, 58, 66, 74, 69, 55, 80, 63, 67, 72, 60, 65,
              70, 59, 76, 68, 64, 73, 61, 66, 70, 57, 75, 69])
n = len(x)
mean = x.mean()
sd = x.std(ddof=1)           # sample standard deviation
se = stats.sem(x)            # standard error of the mean (ddof=1 by default)
low, high = stats.t.interval(0.95, df=n - 1, loc=mean, scale=se)

print(round(mean, 2), round(sd, 2), round(se, 2))   # 66.8 6.44 1.29
print(round(float(low), 2), round(float(high), 2))  # 64.14 69.46
Note that NumPy’s np.std() uses n by default; pass ddof=1 to get the sample SD. For help with Python analysis, see our Python assignment help.
Excel
With the 25 scores in A2:A26, use =STDEV.S(A2:A26) for the SD (6.44), =STDEV.S(A2:A26)/SQRT(COUNT(A2:A26)) for the SE (1.29) and =CONFIDENCE.T(0.05,STDEV.S(A2:A26),COUNT(A2:A26)) for the 95% CI half-width (2.66), which you add to and subtract from the mean.
Standard Errors of Other Statistics (and the Standard Error of Measurement)
Every statistic estimated from a sample has its own standard error. You will see these in software output:
- Standard error of a proportion: √[p(1 − p) ÷ n]. For example, if 40% of 200 respondents agree, SE = √(0.4 × 0.6 ÷ 200) ≈ 0.035, or about 3.5 percentage points.
- Standard error of a difference between two means: used in the independent-samples t test to judge whether the gap between groups is larger than expected by chance.
- Standard error of a regression coefficient: shown next to each coefficient in regression output, and used to calculate its t value and confidence interval.
One term causes frequent confusion: the standard error of measurement, used in psychometrics and testing. It describes how much an individual’s observed test score is likely to differ from their “true” score, and is calculated as SD × √(1 − reliability). It is a different concept from the standard error of the mean, even though both are sometimes abbreviated as SEM. Always spell out which one you mean.
Common Mistakes When Using Standard Deviation and Standard Error
- Reporting SE to describe how varied a sample is. Use the SD for that; the SE describes precision, not spread.
- Not saying which measure your error bars show. Readers cannot interpret a graph without knowing whether bars show SD, SE or a confidence interval.
- Using the population formula on sample data. Use n − 1 (STDEV.S in Excel, ddof=1 in NumPy) for sample data.
- Expecting the SD to shrink with more data. Only the SE shrinks systematically as the sample size grows.
- Judging significance from overlapping error bars. Run the appropriate test instead of relying on visual rules of thumb.
- Applying the 68–95 rule to skewed data. The rule is approximate and only works for roughly normal data.
- Confusing the standard error of the mean with the standard error of measurement. They answer different questions.
- Ignoring outliers. A few extreme values can inflate the SD and the SE, which then affects confidence intervals and tests.
- Mixing measures in one table. Use the same measure throughout a table and state it in the column header or note.
- Forgetting the sample size. An SE or confidence interval means little unless readers know n.
If you are preparing descriptive statistics for an assignment, our statistics help for students can walk you through what to report. For larger datasets with many variables to summarise, see our data analysis help.
When to Get Expert Help
Choosing between standard deviation and standard error seems simple until you are building a full set of results tables and figures. Consider expert support if:
- You are preparing descriptive and inferential tables for a dissertation or thesis.
- A supervisor or reviewer has questioned your error bars or reporting.
- You need to decide whether to report SEs or confidence intervals across many analyses.
- Your data are clustered, repeated or otherwise complex, so standard formulas may not apply.
- Your deadline is close.
Our statisticians have completed more than 2,500 projects with a 4.9/5 average rating and 98% on-time delivery. Our team includes Dr. Grace Mwangi (PhD in Biostatistics), Daniel Okoro (MSc in Applied Statistics), Esther Ndlovu (MPhil in Quantitative Finance) and Amelia Clarke (PhD in Educational Research). All research files and project details remain confidential.
Pricing depends on the type of task, its complexity, your academic level, the deadline, data size and cleaning needs, the software required and the level of writing support, with no hidden charges. Every enquiry starts with a free initial consultation, and we aim to respond within 2 hours on business days. Whether you need one table checked or full dissertation data analysis help, tell us about your project.
Get Statistical Help Now · See how pricing works
Frequently Asked Questions
Is standard error always smaller than standard deviation?
The standard error of the mean equals the SD divided by √n, so with any sample of two or more it is smaller than the SD. The larger the sample, the bigger the gap.
Should I report SD or SE in my results table?
Use the SD when the table describes your sample, for example participant characteristics or scale scores. Use the SE or a 95% confidence interval when you want to show how precisely you have estimated a population value. Follow your programme’s or journal’s guidelines and label the measure clearly.
What does a large standard error mean?
A large SE means your estimate is imprecise: another sample could give a noticeably different mean. It usually reflects a small sample, highly variable data or both.
Why does standard error decrease with sample size?
Averaging more values cancels out more of the random variation between individuals, so sample means from larger samples cluster more tightly around the population mean. Mathematically, the SE is divided by √n.
What is the difference between SEM and SD?
In most research reports, SEM means the standard error of the mean, which describes the precision of the mean, while SD describes the spread of individual values. In psychometrics, SEM can also mean the standard error of measurement, which is a different concept. Always define the abbreviation.
Can I convert standard error to standard deviation?
Yes, if you know the sample size: SD = SE × √n. For example, an SE of 1.29 with n = 25 gives an SD of about 1.29 × 5 = 6.45 (6.44 before rounding). This is useful when a published study reports only SEs.
Should error bars show SD or SE?
Show SD bars to describe variability and 95% confidence interval bars to support comparisons. SE bars are common but easy to misread. Whichever you use, state it in the figure caption.
Is standard error the same as the margin of error?
No. The margin of error is usually the half-width of a confidence interval, which is the critical value (such as 1.96 or a t value) multiplied by the standard error. In the worked example, the SE is 1.29 and the 95% margin of error is about 2.66.
Final Thoughts
The question of standard error vs standard deviation comes down to one idea: the SD describes your data, and the SE describes your estimate. Report the mean with its SD to show how varied your sample is, and use the SE or a confidence interval to show how precise your estimate is. Label error bars clearly, use n − 1 for sample data, and remember that only the SE shrinks as your sample grows.
