SEM vs Regression Analysis: Which Method Should You Use?
Choosing between SEM vs regression analysis can determine whether your quantitative results are clear, defensible, and acceptable to your supervisor, journal reviewer, or client. Both methods test relationships between variables, but they are not designed for the same research problem.
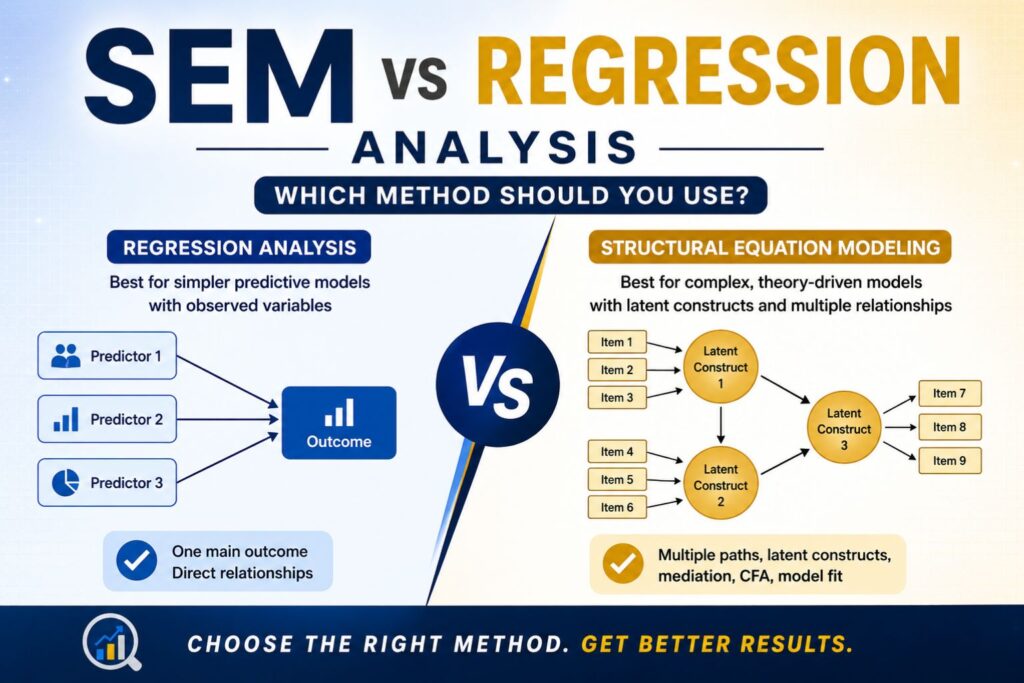
Regression analysis is usually suitable when your study has one main outcome variable and you want to test whether one or more observed predictors explain or predict that outcome. Structural equation modeling, commonly called SEM, is more suitable when your study has a theory-driven model with latent constructs, multiple relationships, measurement error, mediation, CFA, and model fit testing.
Many students lose time because they run regression when their model requires SEM. Others choose SEM because it sounds advanced, even when their sample size, variables, or hypotheses do not support it. The wrong method can lead to weak findings, confusing output, supervisor comments, or repeated Chapter 4 revisions.
If you are unsure whether your dissertation, thesis, journal article, or business research project needs SEM or regression analysis, our statisticians can review your variables, hypotheses, research model, sample size, software requirement, and expected deliverables before analysis begins.
Request a Quote for SEM or Regression Analysis Help
SEM vs Regression Analysis: Direct Comparison
Regression analysis is mainly used when you want to examine whether one or more independent variables predict or explain one dependent variable. For example, you may want to know whether income, age, and education predict customer spending, or whether study time predicts exam performance.
SEM is used when you want to test a broader model that includes several relationships at the same time. It can include latent variables, observed indicators, measurement models, direct effects, indirect effects, multiple dependent variables, mediation, moderation, and model fit indices.
Regression is not weak, and SEM is not automatically better. Regression is often the correct choice for simpler predictive models. SEM is stronger when your study is theory-driven and includes several connected constructs or pathways.
Not sure which one fits your study? Send us your topic, variables, hypotheses, sample size, preferred software, and deadline. We can review your project and recommend the right analysis approach.
Who Needs SEM or Regression Analysis Help?
This service is useful for clients who need more than a basic explanation of statistical methods. It is for people who need to choose the correct analysis, run the model properly, interpret the output, and report the findings in a professional format.
You may need SEM or regression analysis help if you are a dissertation student, PhD candidate, master’s student, journal author, survey researcher, healthcare researcher, psychology researcher, education researcher, business analyst, market researcher, or organization working with quantitative data.
You may also need help if your supervisor, committee, reviewer, or client has asked for SPSS regression, AMOS SEM, SmartPLS analysis, CFA, mediation, moderation, path analysis, or Chapter 4 results interpretation.
For complete research support, you can visit Dissertation Data Analysis Help or Statistical Analysis Services.
What Is Regression Analysis?
Regression analysis is a statistical method used to examine how one or more predictor variables relate to an outcome variable. It helps researchers understand whether a relationship exists, how strong the relationship is, whether it is statistically significant, and how much variation in the outcome can be explained by the predictors.
Regression is commonly used in dissertations, journal articles, survey research, business analytics, healthcare studies, psychology, education, marketing, finance, and social science research.
Common types of regression analysis include simple linear regression, multiple regression, logistic regression, hierarchical regression, mediation analysis using regression, moderation analysis using regression, and panel or longitudinal regression.
Simple linear regression is used when you have one predictor and one continuous outcome. Multiple regression is used when you have several predictors and one continuous outcome. Logistic regression is used when the outcome variable is categorical, such as yes/no, pass/fail, satisfied/not satisfied, or controlled/uncontrolled.
Hierarchical regression is used when predictors are entered in blocks. This helps researchers test whether a new set of variables adds explanatory power beyond variables already included in the model.
Regression is often enough when your study has one main dependent variable, directly observed variables, a simple predictive model, and hypotheses focused on direct effects. It is also useful when the expected output includes coefficients, p-values, confidence intervals, R², adjusted R², odds ratios, ANOVA tables, or diagnostic tests.
For support with model selection, assumptions, results interpretation, and reporting, see Statistical Analysis Services.
What Is Structural Equation Modeling?
Structural equation modeling, or SEM, is a broader statistical modeling framework used to test complex relationships between variables. SEM can combine measurement models and structural models in one analysis.
A measurement model examines how observed items measure a latent construct. For example, customer satisfaction may not be measured by one question only. It may be measured using several survey items. SEM can test whether those items properly represent the construct.
A structural model examines the relationships between constructs. For example, service quality may affect satisfaction, and satisfaction may affect loyalty. SEM can test those paths together instead of running separate regression models.
SEM is commonly used when a study involves latent variables such as customer satisfaction, service quality, trust, loyalty, motivation, leadership, burnout, anxiety, self-efficacy, perceived usefulness, behavioral intention, academic engagement, or employee performance.
SEM can include confirmatory factor analysis, path analysis, mediation, moderation, direct effects, indirect effects, multiple dependent variables, and model fit indices. Common SEM software includes AMOS, SmartPLS, Mplus, LISREL, lavaan in R, and Stata SEM.
If your dissertation requires SEM, CFA, AMOS, SmartPLS, or model interpretation, see Dissertation Data Analysis Help.
SEM vs Regression Analysis: Key Differences
| Area of comparison | Regression analysis | SEM | Practical decision |
|---|---|---|---|
| Main purpose | Tests prediction or explanation of one main outcome | Tests a full theoretical model | Use regression for simpler prediction; use SEM for complex theory testing |
| Type of research question | “Does X predict Y?” | “How do several constructs relate in a model?” | SEM is better for broader conceptual models |
| Number of dependent variables | Usually one main dependent variable per model | Can handle multiple dependent variables | Use SEM when outcomes are connected |
| Observed variables | Works well with observed variables | Can use observed and latent variables | Regression is enough for directly measured variables |
| Latent variables | Not designed for latent constructs | Strong for latent constructs | Use SEM when constructs are measured by multiple items |
| Measurement error | Usually not directly modeled | Can account for measurement error | SEM is stronger when measurement quality matters |
| Model complexity | Best for simpler models | Best for complex path models | SEM handles more complex relationships |
| Direct effects | Strong for direct effects | Strong for direct effects | Both can test direct effects |
| Indirect effects | Can test mediation | Can test complex indirect effects | SEM is stronger for multiple mediators |
| Mediation | Possible using regression-based methods | Often stronger for theory-driven mediation | SEM is better for latent mediation models |
| Moderation | Common in regression | Possible in SEM | Choice depends on model and software |
| Multiple relationships | Usually separate models | Tests multiple paths together | SEM is better for simultaneous models |
| Theory testing | Can test theory in simpler models | Designed for theory-driven models | SEM is stronger for conceptual frameworks |
| Predictive modeling | Very useful | Useful, especially in PLS-SEM | Regression is often easier for prediction |
| Model fit indices | Limited overall model fit | Provides fit indices in covariance-based SEM | Use SEM when model fit must be reported |
| Sample size needs | Often lower than SEM | Usually higher than regression | SEM needs careful sample-size review |
| Software options | SPSS, R, Stata, Excel, Python | AMOS, SmartPLS, Mplus, R, Stata | Software depends on method and project |
| Ease of interpretation | Easier for most readers | More complex | Regression is simpler to explain |
| Dissertation use | Common in quantitative dissertations | Common in theory-based survey dissertations | Use the method that fits the design |
| Business research use | Forecasting, drivers, prediction | Satisfaction, loyalty, behavior models | Use SEM for relationship systems |
| Best use case | Simple predictive relationship | Complex theoretical model | The research question decides |
Regression is often easier to run, explain, and report. SEM can better represent complex theoretical models when the sample size, measurement quality, and research design support it.
SEM vs Regression Analysis: Which One Fits Your Study?
| Your study situation | Better method | Reason |
|---|---|---|
| You have one continuous outcome and several predictors | Regression | The model is mainly predictive |
| You have one binary outcome such as yes/no or pass/fail | Logistic regression | The dependent variable is categorical |
| You have survey constructs measured by several items | SEM | SEM can test latent variables and measurement quality |
| You need CFA before testing hypotheses | SEM | CFA is part of the measurement model process |
| You need to test several dependent variables together | SEM | SEM can estimate multiple paths at once |
| You only need to test whether X predicts Y | Regression | Regression is simpler and suitable |
| You need to test mediation with latent constructs | SEM | SEM handles latent mediation better |
| You have a small sample and a simple model | Regression | SEM may be too demanding for the sample |
| Your supervisor specifically requested AMOS or SmartPLS | SEM | These are SEM-focused tools |
| Your supervisor specifically requested SPSS regression | Regression | SPSS is commonly used for regression |
| You need model fit indices such as CFI, TLI, RMSEA, or SRMR | SEM | Regression does not provide full SEM fit indices |
| You need a simple business prediction model | Regression | Regression is often clearer for business prediction |
| You need a customer satisfaction and loyalty model | SEM | SEM fits connected relationship models |
This table is only a guide. Your final choice should be based on your research questions, hypotheses, measurement structure, sample size, and reporting requirements.
For projects involving survey data, scale items, Likert variables, customer satisfaction models, or dissertation questionnaires, see Survey Data Analysis Help.
When Should You Use Regression Analysis?
You should use regression analysis when your study is mainly about prediction, explanation, or direct relationships between variables. Regression is often the best choice when the model is simple, the variables are directly measured, and there is one main outcome variable.
Use regression when your research question is mainly about whether X predicts Y, how strongly X predicts Y, or whether several predictors explain one outcome.
Regression may be suitable when your study asks questions such as:
- Does income predict customer spending?
- Do age, education, and work experience predict salary?
- Does study time predict exam performance?
- Does treatment group predict post-test score after controlling for pre-test score?
- Do service quality dimensions predict customer satisfaction?
Regression is also useful when your supervisor has specifically requested regression analysis, your sample size may not support SEM, or your study does not require latent variables or CFA.
Need help choosing the correct regression model? Our statisticians can review your variables, assumptions, and hypotheses before analysis. Request a quote for regression analysis help.
For regression support in SPSS, see SPSS Data Analysis Help.
When Should You Use SEM?
You should use SEM when your research model is more complex than a single predictive relationship. SEM is usually better when your study is theory-driven, includes latent constructs, has several paths, or requires confirmatory factor analysis.
SEM is often suitable when each construct is measured using several survey items. For example, if customer satisfaction is measured using five questionnaire items, SEM can test whether those items represent the satisfaction construct before testing the relationship between satisfaction and loyalty.
SEM is also useful when you need to test direct and indirect effects together. For example, service quality may influence customer loyalty indirectly through customer satisfaction. Regression can test mediation, but SEM can test the broader structure more comprehensively, especially when latent variables are involved.
SEM may be suitable for models such as:
- Service quality affects satisfaction, and satisfaction affects loyalty.
- Leadership affects employee engagement through motivation.
- Perceived usefulness affects technology adoption through attitude and intention.
- Academic support affects student success through engagement and self-efficacy.
- Burnout affects turnover intention through job satisfaction.
Use SEM when your dissertation committee expects AMOS, SmartPLS, Mplus, lavaan, path diagrams, CFA, model fit indices, or a theory-driven structural model.
If your model has latent constructs, several paths, or mediation effects, request a quote before choosing between AMOS, SmartPLS, Mplus, R, or Stata.
For broader research support, see Data Analysis Services.
Is SEM Better Than Regression?
SEM is not automatically better than regression. SEM is more advanced in some situations, but that does not mean it is always the correct method.
SEM is stronger when your study has latent variables, measurement error, CFA, multiple outcomes, indirect effects, and a full theoretical model. Regression is often better when your study has a simpler structure, observed variables, one main outcome, and a clear predictive question.
A simple dissertation with one dependent variable may not need SEM. A theory-based survey study with several latent constructs may be too limited if analyzed only with regression.
The best method depends on your research question, hypotheses, number of variables, type of variables, sample size, software requirement, supervisor expectations, journal guidelines, and expected deliverables.
Can Regression and SEM Give Different Results?
Regression and SEM can produce different results because they estimate relationships differently.
Regression usually works with observed variables or composite scores. For example, a researcher may average five satisfaction items into one satisfaction score and then use that score in a regression model.
SEM can treat satisfaction as a latent construct measured by several observed indicators. This allows the model to account for measurement error and test whether the items properly measure the construct.
SEM can also test several equations at the same time. Regression often tests one equation at a time. Because of these differences, coefficients, significance levels, and interpretations may differ.
This matters in dissertation and journal reporting because the method affects how results are interpreted. A model that looks acceptable in regression may not show acceptable fit in SEM. Similarly, a relationship that appears weak in a regression model may behave differently when measurement error and indirect paths are included.
SEM vs Multiple Regression
Multiple regression tests how several predictors relate to one outcome variable. For example:
Customer loyalty = service quality + satisfaction + price perception
This model can show whether service quality, satisfaction, and price perception predict customer loyalty. It can also show the strength and significance of each predictor.
SEM can test a more complete theory-based pathway. For example:
Service quality → satisfaction → loyalty
In SEM, service quality and satisfaction can also be measured using multiple survey items. SEM can test whether the measurement model is valid and whether satisfaction mediates the relationship between service quality and loyalty.
Multiple regression may be enough when the researcher only needs direct prediction. SEM may be better when the researcher wants to test the full theoretical process behind the relationship.
SEM vs Path Analysis
Path analysis is related to SEM, but it is not the same as full SEM.
Path analysis tests relationships between observed variables. It can examine multiple direct and indirect paths, but it does not include latent variables or measurement models.
SEM can include both observed and latent variables. It can test the measurement model and the structural model. This makes SEM stronger when your study includes constructs measured by multiple survey items.
Path analysis may be suitable when your model has several relationships but all variables are directly measured. Full SEM may be better when your model includes latent constructs and CFA.
SEM vs Mediation Regression
Regression-based mediation can test whether one variable explains the relationship between an independent variable and a dependent variable. For example, a researcher may test whether job satisfaction mediates the relationship between leadership style and turnover intention.
SEM can also test mediation, but it is often stronger when the model includes multiple mediators, several outcomes, latent constructs, or a full theoretical structure.
SEM is especially useful when the researcher needs to test direct effects, indirect effects, and total effects in one model. Bootstrap confidence intervals may also be used to evaluate indirect effects, depending on the software and method.
Regression-based mediation may be enough for simpler models. SEM may be better for dissertation models that include several constructs, multiple paths, and measurement models.
SEM vs Hierarchical Regression
Hierarchical regression is used when predictors are entered into the model in blocks. This helps researchers test whether one group of variables adds explanatory power beyond another group.
For example, a researcher may first enter demographic variables, then add psychological variables, and then add organizational variables. The goal is to see whether each block improves the model.
SEM is different because it tests a full model of relationships. It can include several paths, latent variables, indirect effects, and model fit. Hierarchical regression is best for incremental prediction. SEM is best for testing complex theory-driven models.
Sample Size for SEM vs Regression Analysis
Sample size is one of the most important factors when choosing between SEM and regression analysis.
Regression can often work with smaller samples than SEM, depending on the number of predictors, effect size, missing data, and assumptions. However, regression still needs enough cases to produce stable and meaningful estimates.
SEM usually requires a larger sample because it estimates more parameters. A model with many latent variables, many indicators, several paths, and multiple mediators will require more data than a simple path model.
PLS-SEM may sometimes be used for prediction-oriented studies or smaller samples, but it still requires justification. It should not be chosen only because the sample is small.
There is no single universal sample-size rule that applies to every SEM model. Sample size should be reviewed in relation to model complexity, number of indicators, number of constructs, estimation method, missing data, distribution, and statistical power.
Send us your sample size, model diagram, variables, and hypotheses, and we can advise whether SEM or regression is more realistic for your study.
Assumptions of Regression and SEM
Regression and SEM both require assumption checking. Running the wrong test or ignoring assumptions can lead to weak results, incorrect interpretation, and supervisor revision requests.
Common regression assumptions include:
- Linearity between predictors and outcome
- Independence of observations
- Normality of residuals
- Homoscedasticity of residuals
- No serious multicollinearity
- Correct variable coding
- Correct model specification
- Absence of influential outliers where relevant
Common SEM assumptions and requirements include:
- Adequate sample size
- Correct model specification
- Model identification
- Valid measurement model
- Acceptable reliability and validity
- Reasonable distributional properties
- Appropriate missing data handling
- Theoretically justified paths
- Acceptable model fit
- Proper estimation method
Assumption testing is one reason clients should not simply run a model without statistical review. A method may look correct in theory but fail because of poor measurement, weak sample size, missing data, multicollinearity, non-normality, or an unidentified model.
Software for SEM and Regression Analysis
| Software | Best for regression | Best for SEM | Notes |
|---|---|---|---|
| SPSS | Simple, multiple, logistic, hierarchical regression, mediation, moderation, diagnostics | Requires AMOS for full SEM | Common for dissertation regression analysis |
| AMOS | Limited regression use | Covariance-based SEM, CFA, path analysis | Common for dissertation SEM |
| SmartPLS | Not mainly used for traditional regression | PLS-SEM and prediction-oriented SEM | Useful for certain survey-based models |
| R | Regression, mediation, moderation, diagnostics | SEM through packages such as lavaan | Flexible and powerful |
| Stata | Regression, panel models, logistic regression | SEM and generalized SEM | Useful for academic and applied research |
| Mplus | Advanced modeling | Advanced SEM, latent growth, categorical indicators, multilevel SEM | Strong for complex SEM |
| Excel | Basic regression | Not suitable for full SEM | Limited for advanced research |
| Python | Regression and predictive modeling | Less common for traditional dissertation SEM | Strong for analytics and machine learning |
SPSS is strong for regression, assumption tests, mediation, and moderation, but it does not directly run full SEM without AMOS. AMOS is commonly used for covariance-based SEM and dissertation SEM. SmartPLS is commonly used for PLS-SEM and prediction-oriented models. R and Stata can support both regression and SEM. Mplus is strong for advanced SEM.
For software-specific support, see SPSS Data Analysis Help.
Our Statistical Analysis Approach
We do not recommend SEM or regression based only on what sounds advanced. We review the structure of your study before deciding which method is appropriate.
Our process may include reviewing your research topic, research questions, hypotheses, conceptual framework, variables, scale items, sample size, missing data, software instructions, and supervisor comments.
For regression projects, we check whether the dependent variable, predictors, assumptions, coding, model type, and interpretation plan are appropriate. This may include checking linearity, normality of residuals, multicollinearity, outliers, homoscedasticity, model fit, and coefficient interpretation.
For SEM projects, we check whether the constructs, indicators, measurement model, structural model, sample size, estimation method, fit indices, and path relationships are appropriate. This may include CFA, reliability, validity, model fit, direct effects, indirect effects, total effects, and path diagram interpretation.
This approach helps reduce the risk of choosing a method that does not match your research design.
Pricing for SEM vs Regression Analysis Help
Pricing for SEM and regression analysis help depends on the complexity of your project. A simple regression project usually costs less than a full SEM project because regression often involves fewer model components.
SEM projects often cost more because they may require data screening, reliability testing, CFA, model specification, model fit assessment, path analysis, mediation testing, modification review, bootstrapping, path diagrams, and detailed interpretation.
Pricing may depend on:
- Number of variables
- Number of hypotheses
- Type of model
- Regression or SEM complexity
- Whether CFA is required
- Whether mediation or moderation is required
- Software required
- Dataset condition
- Deadline
- Number of outputs needed
- Whether Chapter 4 or results interpretation is required
- Whether tables, figures, and path diagrams are needed
- Whether revisions are included
| Service | Best for | Pricing guidance | What is included |
|---|---|---|---|
| Basic regression analysis help | Simple prediction models | Request quote | Model setup, output, interpretation |
| Multiple regression analysis help | Several predictors and one outcome | Depends on number of variables | Assumptions, coefficients, R², interpretation |
| Logistic regression analysis help | Binary or categorical outcomes | Request quote | Odds ratios, model fit, classification, interpretation |
| Mediation or moderation analysis help | Indirect or interaction effects | Depends on model complexity | Path estimates, interaction or indirect effects, reporting |
| Hierarchical regression help | Block-based predictor entry | Request quote | Model blocks, R² change, interpretation |
| Basic path analysis help | Multiple observed-variable paths | Depends on model complexity | Path model, direct/indirect effects, interpretation |
| CFA and measurement model support | Latent construct validation | Custom quote after reviewing constructs | Loadings, reliability, validity, fit indices |
| Full SEM analysis help | Theory-driven latent models | Best quoted after model review | CFA, structural model, fit, paths, interpretation |
| AMOS SEM dissertation package | Dissertation SEM using AMOS | Dissertation package pricing available | AMOS output, diagram, model fit, reporting |
| SmartPLS SEM dissertation package | PLS-SEM dissertation models | Depends on constructs and indicators | Measurement model, structural model, bootstrapping |
| Full dissertation data analysis and Chapter 4 support | Complete results chapter support | Custom quote | Data screening, analysis, tables, figures, write-up |
To give an accurate quote, we review your research questions, hypotheses, dataset, variables, analysis plan, software requirement, deadline, and expected deliverables. This helps us recommend the correct method and avoid charging you for analysis you do not need.
A quote is especially important for SEM projects because two SEM models can require very different levels of work. One project may only need a simple path model, while another may need data cleaning, CFA, reliability testing, convergent validity, discriminant validity, model fit evaluation, mediation, bootstrapping, modification review, and Chapter 4 writing.
Get Help Now: Request a Quote for SEM or Regression Analysis
What We Can Help You With
Our statistical analysis support is designed for students, researchers, and professionals who need help choosing, running, interpreting, and reporting the correct analysis.
We can help with choosing between SEM and regression, reviewing research questions, reviewing hypotheses, checking variable suitability, cleaning data, coding variables, running descriptive statistics, and testing regression assumptions.
We can also help with simple regression, multiple regression, logistic regression, hierarchical regression, mediation, moderation, CFA, SEM, path analysis, AMOS models, SmartPLS models, coefficient interpretation, model fit interpretation, APA-style tables, figures, path diagrams, Chapter 4 results, and supervisor revision responses.
If you need dissertation-focused support, see Dissertation Data Analysis Help.
If your project uses survey data, see Survey Data Analysis Help.
If you need charts, tables, dashboards, or visual summaries of your results, see Data Visualization Services.
SEM vs Regression Analysis for Dissertation Research
Many dissertation and thesis students struggle with SEM vs regression analysis because supervisors may mention regression, SEM, AMOS, SmartPLS, CFA, mediation, or moderation without clearly explaining which method fits the study.
This can create confusion in Chapter 3, Chapter 4, defense preparation, and revision stages. A student may write a methodology chapter that mentions regression, but the conceptual framework may actually require SEM. Another student may propose SEM, but the sample size, variables, or measurement structure may not support it.
We can help align your research questions, hypotheses, conceptual framework, methodology chapter, dataset, sample size, software, university guidelines, results chapter, and supervisor feedback.
Before you run the wrong model or submit weak results, request a quote and let us review your analysis plan.
SEM vs Regression Analysis for Business and Market Research
Regression and SEM are also useful in business research, market research, customer analytics, employee research, and performance analysis.
Regression may be used for sales prediction, customer behavior analysis, churn analysis, pricing analysis, marketing campaign analysis, employee performance drivers, revenue forecasting, and operational performance.
SEM may be used for customer satisfaction models, customer loyalty models, service quality models, brand trust models, perceived value models, employee engagement models, technology acceptance models, and behavioral intention models.
For example, a business may use regression to identify which factors predict customer churn. Another business may use SEM to test whether service quality affects satisfaction, satisfaction affects trust, and trust affects loyalty.
For business-focused analysis, see Data Analysis Services.
Common Mistakes When Choosing SEM or Regression
One common mistake is choosing SEM only because it sounds more advanced. SEM should be used because it fits the research model, not because it looks impressive.
Another mistake is using regression when the study has latent constructs measured by several survey items. In that case, SEM or CFA may be more appropriate.
Some researchers use SEM with an inadequate sample size. A complex SEM model with many constructs and indicators may not be stable if the sample is too small.
Another common issue is averaging survey items without checking reliability. If the items do not measure the same construct well, the regression or SEM results may be weak.
Some students skip CFA and move straight to structural model testing. This is a problem when latent constructs are involved because the measurement model should be checked first.
Another mistake is reporting SEM paths without model fit indices. In covariance-based SEM, fit indices help show whether the model fits the data reasonably well.
Researchers may also ignore measurement error, use too many variables for the available sample, choose software before choosing the correct method, or copy another dissertation’s analysis method without checking whether it fits their own study.
Other mistakes include treating correlation, regression, path analysis, and SEM as interchangeable; ignoring supervisor or journal requirements; using SEM without a clear theoretical framework; and reporting statistical output without meaningful interpretation.
How to Decide Between SEM and Regression
Use this checklist before choosing your method:
- Do you have one dependent variable or multiple outcomes?
- Are your variables observed or latent?
- Are your constructs measured using multiple survey items?
- Are you testing prediction or a full theoretical model?
- Do you need CFA?
- Do you need mediation or indirect effects?
- Do you need moderation?
- Do you need several paths tested at the same time?
- Do you need model fit indices?
- Is your sample size enough for SEM?
- Does your supervisor require SPSS, AMOS, SmartPLS, Mplus, R, or Stata?
- Do you need dissertation-ready interpretation?
- Do you need APA-style tables and figures?
- Do you need help responding to supervisor comments?
If you are still unsure, send us your topic, hypotheses, variables, sample size, preferred software, and deadline. We will review your project and recommend the most suitable analysis approach.
Why Choose StatisticalAnalysisHelp.com?
StatisticalAnalysisHelp.com provides dissertation-focused and research-focused statistical support for students, researchers, and organizations that need accurate, clear, and well-reported results.
We help with both SEM and regression analysis. Our support covers SPSS, AMOS, SmartPLS, R, Stata, Mplus, Excel, and Python, depending on the needs of your project.
We do not only provide raw statistical output. We help you understand which method fits your study, how to interpret the results, how to report the findings, and how to respond to supervisor comments.
Our support may include data cleaning, assumption testing, model selection, regression analysis, CFA, SEM, path diagrams, model fit interpretation, APA-style tables, results write-up, and revision support.
Pricing is custom because every project is different. A simple regression project is not the same as a full SEM dissertation model with CFA, mediation, and Chapter 4 interpretation. Quote-based pricing helps ensure you only pay for the support you actually need.
Request a Custom Quote for Your SEM or Regression Project
Request a Quote for SEM vs Regression Analysis Help
Send us your research topic, research questions, hypotheses, dataset status, sample size, preferred software, deadline, and supervisor instructions. We will review your project and provide a custom quote for SEM analysis help, regression analysis help, or full dissertation data analysis support.
FAQs About SEM vs Regression Analysis
What is the main difference between SEM and regression analysis?
Regression analysis usually tests how one or more predictors relate to one outcome variable. SEM tests a broader model that may include latent variables, multiple paths, measurement models, mediation, and model fit.
Is SEM the same as regression?
No. SEM can include regression-like paths, but it is broader than regression. SEM can test multiple relationships at once and can include latent variables and measurement models.
Is SEM better than regression?
SEM is not always better. SEM is better for complex theory-driven models with latent constructs and multiple relationships. Regression is better for simpler predictive models with observed variables.
When should I use regression instead of SEM?
Use regression when your study has one main outcome, observed variables, direct hypotheses, and a simpler predictive model.
When should I use SEM instead of regression?
Use SEM when your study has latent constructs, multiple relationships, CFA, mediation, indirect effects, or a full theoretical model.
Can regression test mediation?
Yes. Regression-based methods can test mediation, especially in simpler models. However, SEM may be stronger for complex mediation models involving latent variables or multiple mediators.
Can SEM test mediation?
Yes. SEM is commonly used to test mediation, including direct effects, indirect effects, and total effects.
Can regression test moderation?
Yes. Regression can test moderation using interaction terms. This is common in SPSS, R, Stata, and other statistical tools.
Can SEM include moderation?
Yes. SEM can include moderation, but the approach depends on the software, model type, and variable structure.
Does SEM require a larger sample size than regression?
Usually, yes. SEM often requires a larger sample because it estimates more parameters. However, the required sample size depends on model complexity, number of indicators, estimation method, and missing data.
Can SPSS run SEM?
SPSS is commonly used for regression, but full SEM is usually done through AMOS, which is often used alongside SPSS.
Should I use AMOS or SmartPLS for SEM?
AMOS is commonly used for covariance-based SEM, while SmartPLS is used for PLS-SEM. The choice depends on your research goal, model type, sample size, data structure, and supervisor requirements.
Is SmartPLS better than AMOS?
SmartPLS is not automatically better than AMOS. SmartPLS and AMOS are used for different SEM approaches. The better choice depends on your research design and analysis requirements.
Can SEM be used in dissertation research?
Yes. SEM is commonly used in dissertation research, especially in studies with theoretical models, latent constructs, survey items, mediation, and CFA.
Can regression be used in dissertation research?
Yes. Regression is widely used in dissertation research when the study involves prediction, explanation, or direct relationships between observed variables.
How much does SEM analysis help cost?
SEM analysis pricing depends on the number of constructs, indicators, hypotheses, software, CFA requirements, mediation needs, deadline, and reporting requirements. Request a quote for accurate pricing.
How much does regression analysis help cost?
Regression analysis pricing depends on the number of variables, type of regression, assumptions, interpretation, and deliverables. Basic regression projects are usually more affordable than full SEM projects.
Can you help me decide between SEM and regression?
Yes. You can send your topic, research questions, hypotheses, variables, sample size, and supervisor instructions. We can review your project and recommend the most suitable method.
Can you write my Chapter 4 results after analysis?
Yes. We can help interpret the results and prepare Chapter 4-style reporting, including tables, figures, coefficients, model fit, assumptions, and written explanation.
Can you revise SEM or regression results after supervisor feedback?
Yes. We can review supervisor comments and help revise the analysis, interpretation, tables, figures, or results write-up.
Conclusion
Regression analysis is useful for simpler predictive models where the researcher wants to test how one or more observed variables predict one main outcome. SEM is stronger for theory-driven models with latent variables, measurement error, multiple relationships, mediation, CFA, and model fit testing.
The right choice depends on your research question, variables, sample size, hypotheses, software, and expected deliverables. Choosing the wrong method can create problems in your methodology chapter, results chapter, dissertation defense, journal submission, or business report.
Before you choose or run the wrong analysis, request a quote and let us review your model, variables, sample size, and research goals.
Request a Quote Now for SEM vs Regression Analysis Help