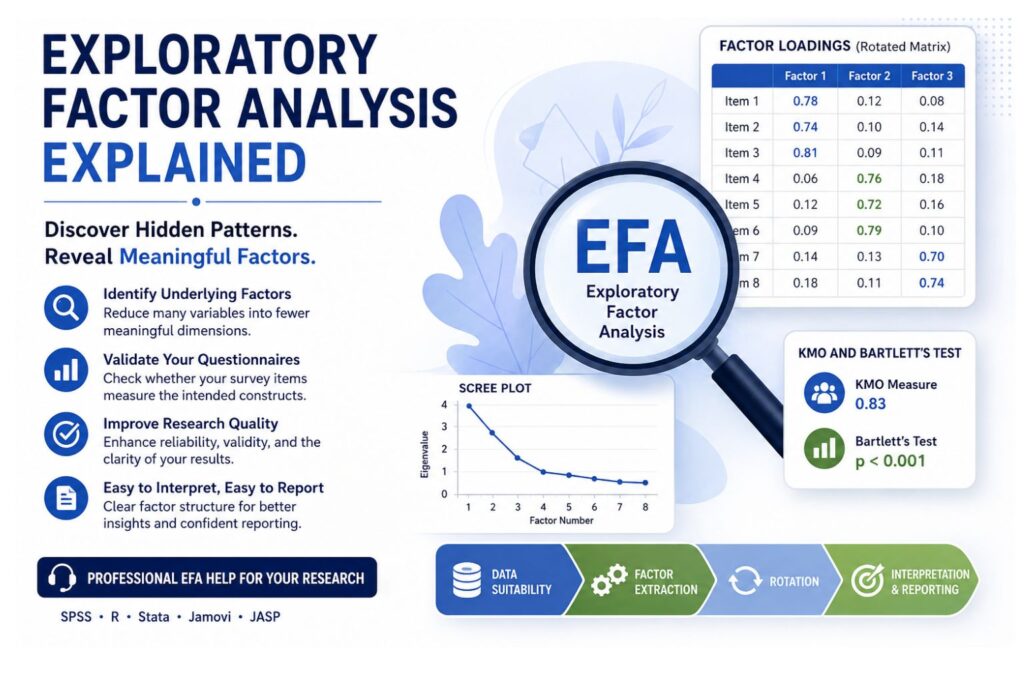
Exploratory Factor Analysis Explained means understanding how EFA helps researchers discover hidden patterns among related variables, especially questionnaire items, survey scales, psychological measures, healthcare instruments, education surveys, business constructs, and public health indicators. Instead of treating every item as a separate variable, exploratory factor analysis helps identify whether many observed items are measuring fewer underlying factors.
For example, a questionnaire with 30 items may appear complicated at first. After exploratory factor analysis, those items may group into clearer factors such as academic confidence, learning anxiety, institutional support, service satisfaction, leadership support, customer trust, or health behavior. This makes the data easier to interpret and report.
EFA is widely used in dissertation data analysis, thesis research, psychology, education, healthcare, public health, business, marketing, management, and social science research. It is especially useful when the researcher does not yet know the exact factor structure and wants to explore how items naturally group together.
However, EFA is not just a software procedure. Running the command in SPSS, R, Stata, Jamovi, or JASP is only one step. A strong exploratory factor analysis also requires suitability checks, factor extraction, factor retention decisions, rotation choice, factor loading interpretation, communality review, cross-loading decisions, factor naming, reliability analysis, and clear APA-style reporting.
At StatisticalAnalysisHelp.com, we help students, researchers, and professionals run, interpret, and report exploratory factor analysis correctly. You can send your dataset, SPSS file, questionnaire items, survey scale, research objectives, supervisor feedback, or dissertation instructions. We can help you check whether EFA is suitable, choose the correct method, interpret KMO and Bartlett’s test, explain factor loadings, review communalities, decide what to do with weak or cross-loading items, run Cronbach’s alpha, and prepare a clear results section.
Need help running exploratory factor analysis?
Send your dataset and questionnaire items for professional EFA support. We can help you move from confusing SPSS output to a clear, defensible, report-ready interpretation.
Quick Answer: What Is Exploratory Factor Analysis?
Exploratory factor analysis is a statistical method used to identify underlying factors among related observed variables. It helps reduce many questionnaire items or measured variables into fewer meaningful dimensions.
It is called exploratory because the researcher is exploring the factor structure rather than testing a fixed model. If the researcher already has a confirmed model and wants to test whether the data fit that model, confirmatory factor analysis may be more appropriate.
A simple example is a 20-item job satisfaction questionnaire. Instead of treating all 20 items separately, EFA may show that the items group into factors such as pay satisfaction, supervisor support, workload, and career growth. These factors then help the researcher understand the structure behind the responses.
| Term | Meaning | Why It Matters |
|---|---|---|
| Factor | A hidden dimension that explains relationships among items | Helps group related variables into meaningful constructs |
| Factor loading | The strength of the relationship between an item and a factor | Shows which items belong to which factor |
| Communality | The proportion of item variance explained by retained factors | Helps identify items that may not fit well |
| Eigenvalue | A value showing how much variance a factor explains | Helps guide factor retention decisions |
| Scree plot | A graph of eigenvalues across possible factors | Helps show where meaningful factors may end |
| KMO test | A measure of sampling adequacy | Shows whether data may be suitable for factor analysis |
| Bartlett’s test | A test of whether variables are sufficiently correlated | Helps confirm whether factor analysis is appropriate |
| Rotation | A method used to make factor interpretation clearer | Helps produce a more understandable factor solution |
| Cross-loading | When an item loads strongly on more than one factor | May indicate unclear item wording or overlapping constructs |
| Factor score | A computed score representing a person’s standing on a factor | Can sometimes be used in later analysis |
What Is Exploratory Factor Analysis?
Exploratory factor analysis examines whether several observed variables reflect a smaller number of underlying latent variables. Observed variables are the measured items in a dataset, such as survey questions or Likert-scale questionnaire statements. Latent variables are hidden constructs that cannot be measured directly but can be inferred from patterns among observed items.
For example, academic confidence may not appear as one direct measurement in a dataset. Instead, it may be measured using several items such as:
- I feel confident completing assignments.
- I can understand difficult course material.
- I believe I can succeed academically.
- I can manage academic tasks independently.
If these items correlate strongly, EFA may show that they belong to one factor called academic confidence.
EFA is based on the idea that related items may share common variance. Common variance is the part of item variation that items share with each other. Unique variance belongs to individual items, while error variance reflects measurement noise. Exploratory factor analysis focuses on the shared patterns that suggest hidden constructs.
This is why EFA is useful in questionnaire validation. A researcher may begin with many items, but the analysis may show that the items represent fewer, clearer dimensions. Those dimensions can then be named, interpreted, reported, and sometimes used in further analysis.
Why Researchers Use Exploratory Factor Analysis
Researchers use exploratory factor analysis when they need to understand the structure behind several related variables. This is common in survey research because questionnaires often include many items that are expected to measure broader constructs.
EFA helps researchers reduce complexity without losing the meaning of the data. Instead of reporting dozens of individual items, the researcher can identify broader factors that explain patterns in responses.
Researchers use EFA to:
- Reduce many variables into fewer factors.
- Explore hidden structure in questionnaire items.
- Test whether survey items group as expected.
- Support scale development.
- Support early evidence of construct validity.
- Identify weak, unclear, or problematic items.
- Prepare for confirmatory factor analysis.
- Improve dissertation or thesis measurement sections.
- Group related variables before further analysis.
- Understand patterns among correlated variables.
For dissertation and thesis students, EFA is often used when developing a new questionnaire, adapting an existing scale, or validating a survey instrument in a new population. It may also be required when a supervisor asks whether questionnaire items truly measure the intended constructs.
If your questionnaire has many items and you are unsure how they group together, send your item list and dataset for EFA support.
When Should You Use Exploratory Factor Analysis?
Use exploratory factor analysis when you have several related observed variables or questionnaire items and you expect them to reflect underlying latent constructs. EFA is appropriate when the factor structure is unknown, unclear, or needs to be explored before further analysis.
You may use EFA when:
- You have several related questionnaire items.
- You expect hidden constructs behind the observed variables.
- The factor structure is unknown or uncertain.
- You want to explore how items group together.
- You are developing or validating a scale.
- Your supervisor asks for factor analysis.
- You need to reduce many variables into fewer dimensions.
- You want to examine early construct validity evidence.
- You need to identify weak or overlapping items.
- You are preparing for reliability analysis or CFA.
Examples of EFA research questions include:
- What underlying factors explain responses to a student engagement questionnaire?
- Do patient satisfaction items group into service quality dimensions?
- Can employee attitude items be reduced into meaningful workplace factors?
- What latent dimensions exist in a public health behavior scale?
- Do customer experience items form clear dimensions such as trust, satisfaction, and loyalty?
- What factors underlie responses to a mental health screening questionnaire?
EFA works best when it is exploratory but still theory-informed. The researcher should not force the data to produce a preferred result. At the same time, factor interpretation should be guided by item content, prior research, and the purpose of the instrument.
When Not to Use Exploratory Factor Analysis
Exploratory factor analysis is powerful, but it is not suitable for every dataset or research question. Using EFA when the data are weak or the research goal is different can lead to misleading results.
EFA may not be appropriate when:
- Variables are unrelated.
- Sample size is too small for the number of items.
- The data are not suitable for correlation-based analysis.
- The factor structure is already known and should be tested with CFA.
- Items are poorly written or measure unrelated ideas.
- There are too few items per expected factor.
- Variables are categorical and require a specialized workflow.
- KMO is poor.
- Bartlett’s test is not significant.
- The goal is prediction rather than structure discovery.
- The researcher wants to test a fixed theory rather than explore a structure.
For example, if a researcher already has a validated model with clear constructs and wants to test whether the data fit that model, confirmatory factor analysis may be more suitable. If the goal is to predict an outcome, methods such as regression, classification, or machine learning may be more appropriate than EFA.
EFA should not be used simply because it appears advanced. It should be used because the research question, questionnaire structure, and data support factor exploration.
Unsure whether you need EFA, CFA, PCA, reliability analysis, or another method? Send your research objective and questionnaire for method-selection support.
Exploratory Factor Analysis vs Confirmatory Factor Analysis
Exploratory factor analysis and confirmatory factor analysis are related, but they answer different questions. EFA explores possible factor structures. CFA tests a predefined factor structure.
EFA is usually used earlier in scale development when the researcher does not know exactly how items will group. CFA is used later when theory, previous research, or earlier EFA results suggest a specific model that needs to be tested.
| Feature | Exploratory Factor Analysis | Confirmatory Factor Analysis |
|---|---|---|
| Purpose | Explores possible factor structure | Tests a predefined factor structure |
| Research stage | Earlier scale development or uncertain structure | Later validation or theory testing |
| Model structure | More flexible | Pre-specified |
| Hypothesis role | Exploratory and theory-informed | Strongly hypothesis-driven |
| Output focus | Loadings, factors, communalities, rotation | Model fit, standardized loadings, error terms |
| Software | SPSS, R, Stata, Jamovi, JASP | AMOS, Mplus, lavaan in R, SmartPLS |
| Best use | Discovering how items group | Testing whether a proposed model fits |
| Common mistake | Treating EFA as final proof of validity | Using CFA before the model is clear |
A strong research workflow may use EFA to explore the factor structure and then CFA on a different sample to test whether that structure holds. This depends on sample size, study design, and research purpose.
Exploratory Factor Analysis vs Principal Component Analysis
Many students confuse EFA with principal component analysis because both methods reduce many variables into fewer dimensions. However, they are not the same.
PCA is mainly a data reduction method. It transforms variables into components using total variance. EFA is used to identify latent factors that explain shared variance among variables. When the goal is to understand hidden constructs, EFA is usually more suitable than PCA.
| Feature | Exploratory Factor Analysis | Principal Component Analysis |
|---|---|---|
| Main goal | Identify latent factors | Reduce data into components |
| Variance used | Common/shared variance | Total variance |
| Latent construct assumption | Yes | No, not in the same way |
| Best for | Scale development and construct exploration | Data reduction and summarization |
| Common output | Factor loadings, communalities, rotated factor matrix | Component loadings and explained variance |
| Dissertation use | Useful for questionnaire validation | Useful when reduction is the main goal |
| Reporting caution | Requires interpretation of latent constructs | Should not be presented as EFA when latent factors are claimed |
SPSS makes PCA easy to select, which is why many students use it automatically. However, if the research question is about latent constructs, questionnaire validation, or scale structure, common factor analysis methods such as principal axis factoring may be more defensible.
Key Terms in Exploratory Factor Analysis
Understanding EFA output is easier when the main terms are clear.
A factor is an underlying dimension that explains why certain items are correlated. For example, several items about confidence may load onto an academic confidence factor.
A latent variable is a construct that is not directly observed but is inferred from measured items. Examples include anxiety, satisfaction, motivation, trust, perceived quality, and service experience.
An observed variable is a measured item in the dataset. In questionnaire research, observed variables are often Likert-scale items.
A factor loading shows how strongly an item relates to a factor. Higher absolute values indicate stronger relationships.
A communality shows how much of an item’s variance is explained by the retained factors.
An eigenvalue indicates how much variance a factor accounts for. It is often used when deciding how many factors to retain.
A scree plot is a graph that helps show where the meaningful factors may end and weaker factors begin.
Rotation improves interpretability by making the factor structure clearer.
Orthogonal rotation assumes factors are uncorrelated. Varimax is a common orthogonal rotation.
Oblique rotation allows factors to correlate. Direct Oblimin and Promax are common oblique rotations.
A cross-loading occurs when an item loads strongly on more than one factor.
A simple structure means items load strongly on one factor and weakly on others.
A factor score is a computed score that represents a participant’s standing on a factor.
The Kaiser criterion refers to retaining factors with eigenvalues greater than 1, although this rule should not be used alone.
Total variance explained shows how much of the item variance is accounted for by the retained factors.
A pattern matrix is commonly interpreted after oblique rotation because it shows the unique relationship between items and factors.
A structure matrix shows correlations between items and factors, especially when factors are allowed to correlate.
Assumptions and Data Requirements for EFA
Before running exploratory factor analysis, researchers should check whether the data are suitable. EFA depends on meaningful correlations among variables. If the items do not relate to each other, factor analysis may not produce a useful solution.
Important issues include:
- Sample size.
- Number of items.
- Correlations among variables.
- KMO measure of sampling adequacy.
- Bartlett’s test of sphericity.
- Determinant of the correlation matrix.
- Multicollinearity and singularity.
- Linearity.
- Missing data.
- Outliers.
- Measurement level.
- Normality where maximum likelihood extraction is used.
- Reliability of item sets.
- Adequate item-to-factor ratio.
There is no single sample size rule that fits every EFA project. Sample size needs depend on the number of variables, factor loadings, communalities, number of factors, and model clarity. A dataset with strong loadings and clear factors may require fewer cases than a dataset with weak loadings and complex factor patterns.
Researchers should also consider whether the items are conceptually related. A dataset may pass some statistical checks but still produce a weak factor solution if the items measure unrelated ideas.
KMO and Bartlett’s Test Explained
KMO and Bartlett’s test are usually reviewed before interpreting EFA results. They help the researcher decide whether the correlation matrix is suitable for factor analysis.
The KMO measure of sampling adequacy evaluates whether the pattern of correlations is suitable for factor analysis. Higher KMO values suggest that the items share enough common variance for EFA. Low KMO values may suggest that the items do not belong together or that the sample is not suitable.
Bartlett’s test of sphericity checks whether the correlation matrix is significantly different from an identity matrix. If Bartlett’s test is significant, it suggests that the variables are sufficiently correlated for factor analysis.
| Test | What It Checks | How to Interpret | What to Do Next |
|---|---|---|---|
| KMO test | Whether the data have adequate shared variance | Higher values suggest better suitability for EFA | If low, review items, sample size, and correlations |
| Bartlett’s test | Whether variables are correlated enough | A significant result supports factorability | If significant, proceed to extraction cautiously |
Sample reporting wording:
“Exploratory factor analysis was considered appropriate because the KMO measure indicated adequate sampling suitability, and Bartlett’s test of sphericity was statistically significant, suggesting that the correlation matrix was appropriate for factor extraction.”
Good KMO and Bartlett’s results do not automatically guarantee a strong factor solution. The researcher must still review extraction results, communalities, loadings, rotation, cross-loadings, reliability, and theoretical meaning.
Factor Extraction Methods
Factor extraction is the process of identifying the initial factors from the data. The extraction method should match the research goal, data quality, distribution, and reporting expectations.
| Extraction Method | Best Used When | Reporting Caution |
|---|---|---|
| Principal axis factoring | The goal is to identify latent factors based on shared variance | Often suitable when data are not perfectly normal |
| Maximum likelihood extraction | The researcher wants estimates that allow additional statistical testing | More sensitive to normality assumptions |
| Principal component extraction | The goal is data reduction rather than latent factor modeling | This is PCA, not common factor analysis |
| Minimum residual | The goal is to minimize residual correlations | More common in some R-based workflows |
| Unweighted least squares | A least-squares solution is preferred | Should match software and reporting expectations |
Many dissertation students choose an extraction method without understanding what it means. This can weaken the methodology and results sections. If the research goal is latent construct discovery, common factor methods such as principal axis factoring or maximum likelihood are often more appropriate than PCA.
How Many Factors Should You Retain?
Deciding how many factors to retain is one of the most important decisions in exploratory factor analysis. Retaining too many factors can produce a fragmented and confusing solution. Retaining too few can combine different constructs into one unclear factor.
Common factor retention methods include:
- Eigenvalue greater than 1 rule.
- Scree plot.
- Parallel analysis.
- Theoretical interpretability.
- Total variance explained.
- Number of strong loadings per factor.
- Avoiding over-extraction.
- Avoiding under-extraction.
The eigenvalue greater than 1 rule is common, but it should not be used alone. A scree plot can help identify where the curve levels off. Parallel analysis is often more defensible because it compares actual eigenvalues with values expected from random data.
The final decision should combine statistical evidence, theory, and interpretability. A retained factor should have enough strong items to make sense and should be named based on the meaning of those items.
If your SPSS output suggests several possible factor solutions, we can help decide which structure is most defensible for your dissertation, thesis, or research report.
Factor Rotation Explained
Rotation is used to make the factor solution easier to interpret. Without rotation, factor loadings may be spread across several factors in a way that is difficult to explain.
There are two broad types of rotation: orthogonal and oblique.
| Rotation Type | Examples | Assumption | Best Use |
|---|---|---|---|
| Orthogonal rotation | Varimax | Factors are uncorrelated | When theory suggests independent factors |
| Oblique rotation | Direct Oblimin, Promax | Factors may correlate | When constructs are expected to relate |
Varimax rotation is common because it can produce a simpler factor structure. However, in psychology, healthcare, education, public health, management, and social science research, constructs are often related. In those cases, oblique rotation may be more realistic.
Rotation does not change the raw data. It changes the orientation of the factor solution so that item-factor relationships become easier to interpret.
Factor Loadings Explained
Factor loadings show how strongly each item relates to each factor. A high loading means the item is strongly associated with that factor. A low loading may suggest that the item does not represent the factor well.
Researchers often use loading cutoffs such as .30, .40, or .50, depending on the field, sample size, and study purpose. However, cutoffs should not be applied mechanically. An item with a slightly lower loading may still be theoretically important, while an item with a high loading may still be poorly worded, redundant, or inconsistent with the factor meaning.
Positive and negative loadings must be interpreted in context. Negative loadings may occur when items are reverse-worded or when the direction of the factor is opposite to the item wording.
Items with weak loadings may be considered for removal. Items with strong loadings on more than one factor may be cross-loading and may require careful review. Item removal should consider statistics, theory, reliability, and content validity.
Sample interpretation:
“Items with strong loadings on Factor 1 appeared to reflect academic confidence, while items loading on Factor 2 reflected learning anxiety.”
Communalities Explained
Communality is the proportion of an item’s variance explained by the retained factors. Higher communalities suggest that the factor solution explains the item well. Lower communalities may suggest that the item does not fit strongly with the retained factor structure.
Low communality does not automatically mean the item must be removed. The researcher should review item wording, factor loadings, theoretical importance, reliability impact, and the overall factor structure before deciding.
Communalities are useful when identifying items that may weaken the factor solution. If an item has low communality and weak loadings across factors, it may not belong with the other items.
Interpreting the Rotated Factor Matrix
The rotated factor matrix, rotated component matrix, or pattern matrix is one of the most important EFA outputs. It shows how items load onto retained factors.
To interpret the matrix:
- Identify the highest loading for each item.
- Group items by factor.
- Check weak loadings.
- Check cross-loadings.
- Name factors based on item content.
- Avoid naming factors based on one item only.
- Make sure factor names match the theoretical construct.
- Decide whether problematic items should be removed or retained.
Example rotated matrix:
| Item | Factor 1 | Factor 2 | Factor 3 |
|---|---|---|---|
| I feel confident completing assignments | .78 | .12 | .08 |
| I can understand difficult course material | .74 | .10 | .14 |
| I believe I can succeed academically | .81 | .09 | .11 |
| I feel nervous before assessments | .06 | .76 | .18 |
| I worry about failing coursework | .12 | .72 | .16 |
| I feel anxious during exams | .09 | .79 | .10 |
| My institution provides useful academic support | .14 | .13 | .70 |
| I can access guidance when I need help | .18 | .11 | .74 |
In this example, the first three items load strongly on Factor 1, which may be named Academic Confidence. The next three load on Factor 2, which may be named Learning Anxiety. The final two load on Factor 3, which may be named Institutional Support.
The factor names should come from the meaning of the items, not from the software output alone.
Naming Factors After EFA
Naming factors is a judgment process. The software does not name factors for the researcher. The researcher must review the items that load strongly on each factor and identify the shared meaning.
When naming factors:
- Review item wording carefully.
- Look at the shared meaning among high-loading items.
- Avoid overly broad names.
- Avoid names that do not match item content.
- Align factor names with theory and previous literature.
- Be transparent if names are researcher-assigned.
Examples:
- Items about workload, pressure, and deadlines may be named Workload Stress.
- Items about supervisor support, feedback, and guidance may be named Supervisor Support.
- Items about confidence and ability may be named Academic Self-Efficacy.
- Items about trust, repeat purchase, and recommendation may be named Customer Loyalty.
A factor should ideally have several items that support the name. Naming a factor from one item is usually weak unless there is a strong theoretical reason.
Reliability Analysis After EFA
Reliability analysis is often conducted after EFA to check whether the items within each factor work together consistently. EFA identifies factor groupings, while reliability analysis checks internal consistency.
Cronbach’s alpha is commonly used for this purpose. A low alpha may suggest that items within a factor do not work well together. A very high alpha may suggest that some items are redundant. Reliability supports internal consistency, but it does not prove validity by itself.
For example, if EFA identifies a factor called Academic Confidence, the researcher may run Cronbach’s alpha on the items loading onto that factor. If alpha is acceptable and the items make theoretical sense, the factor may be retained for further analysis.
For broader statistical interpretation and reporting support, see our Statistical Data Analysis Help service.
How to Report Exploratory Factor Analysis Results
A good EFA report should explain what was done, why it was done, and what the final factor solution means. It should not simply copy SPSS output into the results chapter.
An EFA report should include:
- Purpose of the EFA.
- Software used.
- Extraction method.
- Rotation method.
- KMO result.
- Bartlett’s test result.
- Criteria for retaining factors.
- Number of factors retained.
- Total variance explained.
- Factor loadings.
- Communalities.
- Removed items, if any.
- Factor names.
- Reliability statistics, if conducted.
- Interpretation of the final factor structure.
Sample APA-style wording:
“Exploratory factor analysis was conducted to examine the underlying structure of the questionnaire items. The KMO measure and Bartlett’s test indicated that the data were suitable for factor analysis. Factors were extracted using [method] and rotated using [rotation]. The final solution retained [number] factors, which explained [percentage]% of the total variance.”
Sample factor interpretation wording:
“The items loading strongly on Factor 1 reflected academic confidence, including confidence in completing assignments, understanding course material, and succeeding academically. Factor 1 was therefore named Academic Confidence.”
A strong write-up connects the statistical output to the research objective. The reader should understand not only what the software produced, but what the factors mean.
Common Mistakes in Exploratory Factor Analysis
Many EFA problems come from poor decisions before or during the analysis. Common mistakes include:
- Using EFA when CFA is required.
- Confusing PCA with EFA.
- Ignoring KMO and Bartlett’s test.
- Using eigenvalue greater than 1 as the only retention rule.
- Choosing Varimax automatically.
- Ignoring cross-loadings.
- Removing items only because of statistics without considering theory.
- Keeping weak items because they support the desired hypothesis.
- Naming factors poorly.
- Reporting output without interpretation.
- Ignoring reliability after EFA.
- Using too small a sample.
- Ignoring missing data.
- Failing to explain extraction and rotation methods.
- Over-extracting or under-extracting factors.
- Treating EFA as proof of construct validity.
A defensible EFA requires both statistical judgment and theoretical reasoning. The final factor structure should make sense statistically and conceptually.
If your EFA output is confusing or your supervisor questioned your factor solution, we can review the output and help prepare a clearer interpretation.
Exploratory Factor Analysis in SPSS
SPSS is commonly used for exploratory factor analysis because it provides menu-based options and useful output for dissertation and thesis reporting. However, the challenge is not simply clicking the factor analysis command. The real challenge is choosing suitable settings and interpreting the output correctly.
SPSS can produce:
- Correlation matrix.
- KMO and Bartlett’s test.
- Communalities.
- Total variance explained.
- Scree plot.
- Component matrix.
- Rotated component matrix.
- Pattern matrix.
- Structure matrix.
- Factor scores.
Important SPSS settings include the variables to include, extraction method, number of factors, rotation method, suppression of small coefficients, sorting by size, and whether factor scores should be saved.
For example, a student may run EFA in SPSS and see several cross-loading items in the rotated matrix. The question is not only what SPSS shows, but whether those items should be removed, retained, renamed, or reassigned based on theory and reporting requirements.
Send your SPSS output or .sav file for exploratory factor analysis interpretation and APA-style reporting support.
Exploratory Factor Analysis in R, Stata, Jamovi, and JASP
EFA can also be conducted outside SPSS. R is useful for flexible and reproducible EFA workflows, especially when researchers need advanced diagnostics, parallel analysis, or customized output. Stata is useful for applied research workflows in public health, economics, social science, and policy research.
Jamovi and JASP provide user-friendly menu-based analysis options and are useful for students who prefer accessible output. The best tool depends on the research requirements, supervisor expectations, and reporting format.
StatisticalAnalysisHelp.com can support interpretation and reporting across multiple tools, including SPSS, R, Stata, Jamovi, JASP, and Excel-based preparation where appropriate.
Exploratory Factor Analysis Examples
Psychology Example
A psychology researcher develops a 24-item questionnaire on student well-being. The items cover anxiety, self-confidence, social support, and motivation. EFA may reveal four factors: learning anxiety, academic confidence, peer support, and motivation. This helps the researcher show that the questionnaire items represent meaningful psychological dimensions.
Education Example
An education student collects survey data on online learning experience. The questionnaire includes items about course design, instructor support, technology access, and learner confidence. EFA may show that the items group into factors such as course design, instructor support, and learner confidence. The student can then use those factors in later analysis.
Healthcare Example
A healthcare researcher studies patient satisfaction using items on communication, waiting time, staff responsiveness, facility cleanliness, and perceived care quality. EFA may identify factors such as communication quality, service efficiency, and environment satisfaction. This helps the researcher report patient satisfaction in a more structured way.
Public Health Example
A public health researcher uses a behavior scale to measure preventive health practices. Items may include hygiene behavior, vaccination attitudes, health information seeking, and risk perception. EFA can help determine whether these items form distinct public health behavior dimensions.
Business and Management Example
A management researcher studies employee engagement using items related to leadership, recognition, workload, autonomy, and career growth. EFA may identify factors such as leadership support, workload pressure, recognition, and career development.
Marketing Example
A marketing researcher studies customer experience using items on trust, satisfaction, perceived value, service quality, and repurchase intention. EFA may reveal factors such as customer trust, perceived value, service quality, and loyalty intention.
In each example, EFA helps the researcher move from many separate items to clearer constructs that can be interpreted, reported, and used in later analysis.
Do You Need Exploratory Factor Analysis Help?
You may need exploratory factor analysis help if you have questionnaire data but do not know whether the items form clear factors. You may also need support if your SPSS output includes KMO, Bartlett’s test, communalities, eigenvalues, scree plots, and rotated matrices that are difficult to interpret.
EFA support is useful when:
- You have a questionnaire but do not know whether the items form clear factors.
- Your SPSS output has several tables you cannot interpret.
- Your supervisor asked you to justify extraction or rotation choices.
- You are unsure whether to use PCA, EFA, CFA, or reliability analysis.
- You have cross-loading items and do not know whether to remove them.
- You need APA-style reporting for a dissertation, thesis, or journal paper.
- Your factor structure does not match expectations.
- You need help naming factors and explaining construct validity.
- Your deadline is close and you need a clear results section.
- You received supervisor feedback asking for revision.
Professional support can help you avoid weak factor solutions, unclear write-ups, unsupported item removal decisions, and poor reporting.
Pricing for Exploratory Factor Analysis Help
Pricing for exploratory factor analysis help is quote-based because every project is different. A simple SPSS output interpretation usually costs less than a full questionnaire validation project with EFA, reliability analysis, item removal decisions, tables, and APA-style reporting.
The cost depends on dataset size, number of items, number of possible factor solutions, software, interpretation needs, reporting requirements, deadline, and whether supervisor feedback must be addressed.
| Service Need | What It May Include | Pricing Basis |
|---|---|---|
| Basic EFA output interpretation | Review KMO, Bartlett’s test, loadings, communalities, and factor structure | Quote based on output length |
| SPSS exploratory factor analysis | Run or review EFA in SPSS and interpret output | Quote based on dataset and number of items |
| Full EFA with APA-style write-up | Analysis, tables, interpretation, and results reporting | Quote based on scope |
| Questionnaire validation support | EFA, item review, factor naming, and reliability guidance | Custom quote |
| EFA plus Cronbach’s alpha | Factor solution plus internal consistency analysis | Quote based on number of factors |
| Supervisor feedback correction | Review comments and revise analysis or write-up | Quote based on feedback volume |
| Urgent EFA support | Faster analysis or interpretation where possible | Quote based on deadline |
| EFA in R, Stata, Jamovi, or JASP | Analysis or interpretation using alternative software | Quote based on software and model needs |
Editable pricing placeholders:
- Basic EFA interpretation: from $ 100
- Full EFA report: from $ 500
- Dissertation EFA support: custom quote
Send your dataset, questionnaire items, software preference, supervisor instructions, and deadline for a custom quote. We will review the scope and tell you what EFA support is needed before work begins.
How We Help With Exploratory Factor Analysis
StatisticalAnalysisHelp.com helps students, researchers, and professionals run, interpret, and report exploratory factor analysis clearly. Our goal is not only to generate output, but to help you understand what the output means and how it should be presented.
We can help with:
- Deciding whether EFA is appropriate.
- Preparing data.
- Checking KMO and Bartlett’s test.
- Choosing extraction method.
- Choosing rotation method.
- Deciding number of factors.
- Interpreting eigenvalues and scree plot.
- Interpreting factor loadings.
- Handling cross-loadings.
- Reviewing communalities.
- Naming factors.
- Removing or retaining items.
- Running reliability analysis.
- Writing APA-style results.
- Preparing tables.
- Responding to supervisor comments.
- Explaining the output in plain language.
Our support is designed to help you move from confusing output to a clear, defensible results section.
Send your questionnaire, dataset, and supervisor instructions for exploratory factor analysis help.
What You Receive
Deliverables depend on your project scope. A small project may only need output interpretation, while a dissertation project may require full analysis, tables, reporting, and feedback correction.
Depending on your needs, you may receive:
- EFA suitability review.
- SPSS, R, Stata, Jamovi, or JASP output interpretation.
- KMO and Bartlett’s test explanation.
- Factor extraction summary.
- Rotation explanation.
- Factor loading interpretation.
- Scree plot interpretation.
- Communality review.
- Item retention or removal guidance.
- Factor naming support.
- Reliability analysis summary where applicable.
- APA-style write-up.
- Tables.
- Explanation notes.
- Revised results based on supervisor feedback where agreed.
The deliverables are matched to your dataset, questionnaire, software, deadline, and reporting instructions.
Why Trust StatisticalAnalysisHelp.com?
Exploratory factor analysis requires more than running a command in SPSS. The output must be interpreted correctly, and the final factor solution must make sense statistically and theoretically. A weak interpretation can make even correct output look confusing.
Clients use StatisticalAnalysisHelp.com because we provide statistical interpretation, not just software output. We help explain factor loadings, communalities, rotation decisions, cross-loading items, factor naming, and reliability results in plain language. This is especially useful for dissertation and thesis students who need to understand their results before submitting them.
We support SPSS, R, Stata, Jamovi, JASP, Excel-based preparation, and related statistical workflows. We also help with both analysis and reporting, so you are not left with tables you cannot explain.
Your files are handled confidentially and used only for the requested project. Personal identifiers may be removed before sharing the data. If the project is not yet complete, our team can still work from partial instructions, exported SPSS output, draft results, supervisor comments, or a dataset that needs review.
StatisticalAnalysisHelp.com does not promise guaranteed grades, guaranteed approval, or guaranteed publication. Instead, the focus is on helping you run the right analysis, understand the output, and present the results clearly.
Related Statistical Analysis Services
If your dataset needs preparation before factor analysis, our Data Analysis Help service can support data review, cleaning, and analysis planning.
For broader statistical interpretation, Statistical Data Analysis Help can support descriptive statistics, inferential tests, model interpretation, and reporting. Students working with numerical data may also need Quantitative Data Analysis for test selection and results interpretation.
If you are using SPSS, SPSS Data Analysis Help can support factor analysis, output interpretation, and APA-style write-up. Dissertation and thesis students may need Dissertation Data Analysis Help for complete results support.
Survey-based projects connect naturally with Survey Data Analysis Help. If your research involves testing hypotheses after factor analysis, Hypothesis Testing Help and Inferential Statistics Help may also be useful.
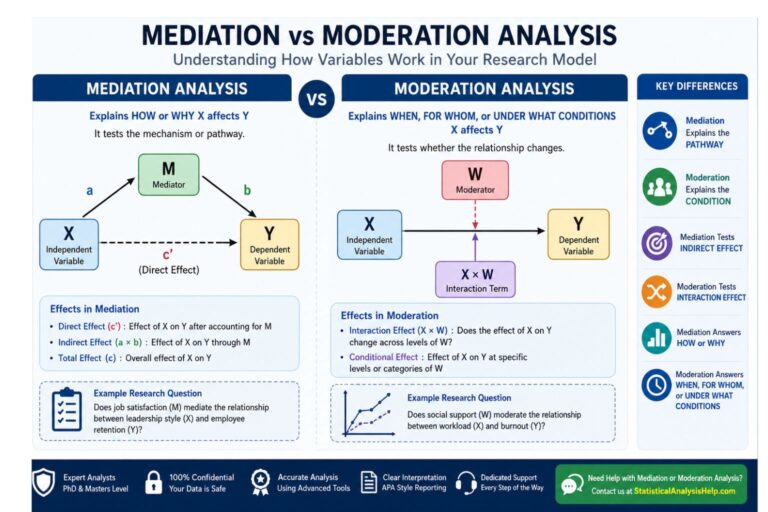
For projects requiring R code, R Coding Help can assist with EFA workflows, while R Data Visualization Help can support graphs and plots. If your model includes indirect or interaction effects after scale validation, see our Mediation vs Moderation Analysis guide.
Frequently Asked Questions About Exploratory Factor Analysis
What is exploratory factor analysis?
Exploratory factor analysis is a statistical method used to identify hidden factors among related variables. It is often used with questionnaire items to discover whether several items measure fewer underlying constructs.
Why is exploratory factor analysis used?
EFA is used to explore factor structure, reduce many items into fewer dimensions, support scale development, examine construct validity, and identify weak or problematic items.
What is the difference between EFA and CFA?
EFA explores possible factor structures when the structure is unknown or uncertain. CFA tests a predefined factor structure based on theory or prior evidence.
What is the difference between EFA and PCA?
EFA identifies latent factors based on shared variance. PCA reduces variables into components using total variance. PCA is mainly a data reduction method, while EFA is used for latent construct exploration.
What is KMO in factor analysis?
KMO measures sampling adequacy and helps determine whether the data are suitable for factor analysis. Higher KMO values suggest that the variables share enough common variance for EFA.
What is Bartlett’s test of sphericity?
Bartlett’s test checks whether the correlation matrix is significantly different from an identity matrix. A significant result suggests that the variables are sufficiently correlated for factor analysis.
What are factor loadings?
Factor loadings show how strongly each item relates to each factor. Higher absolute loadings indicate stronger relationships between the item and factor.
What is a good factor loading?
Common cutoffs include .30, .40, or .50, depending on field, sample size, and research purpose. However, factor loading cutoffs should be interpreted alongside theory, communalities, and item content.
What are communalities?
Communalities show how much of an item’s variance is explained by the retained factors. Low communalities may suggest that an item does not fit well with the factor solution.
How do I decide how many factors to retain?
Factor retention should consider eigenvalues, scree plot, parallel analysis, total variance explained, item loadings, theory, and interpretability. No single rule should be used blindly.
What is a scree plot?
A scree plot is a graph of eigenvalues. It helps researchers identify the point where additional factors contribute little additional explanatory value.
What is Varimax rotation?
Varimax is an orthogonal rotation method that assumes factors are uncorrelated. It is commonly used because it can produce a simpler factor structure.
Should I use orthogonal or oblique rotation?
Use orthogonal rotation when factors are expected to be independent. Use oblique rotation when factors are expected to correlate. In many social science and survey studies, oblique rotation may be more realistic.
Can EFA be used for Likert scale data?
EFA is often used with Likert-scale questionnaire data, but suitability depends on item quality, sample size, correlations, measurement assumptions, and the method used.
What should I do with cross-loading items?
Cross-loading items should be reviewed carefully. You may consider item wording, theoretical importance, loading size, reliability impact, and whether removing the item improves the factor solution.
Should I run Cronbach’s alpha after EFA?
Yes, reliability analysis is often conducted after EFA to check whether the items within each factor have acceptable internal consistency. Cronbach’s alpha is commonly used for this purpose.
How do I report EFA results in APA style?
Report the purpose of EFA, software, extraction method, rotation method, KMO, Bartlett’s test, factor retention criteria, number of factors, variance explained, factor loadings, removed items, factor names, and reliability results where applicable.
Can you help interpret SPSS EFA output?
Yes. You can send your SPSS output or .sav file, and we can help interpret KMO, Bartlett’s test, communalities, eigenvalues, scree plot, rotated factor matrix, factor loadings, and item decisions.
How much does exploratory factor analysis help cost?
The cost depends on dataset size, number of items, software, complexity, reporting needs, deadline, and whether supervisor feedback must be addressed. Send your project details for a custom quote.
How do I order EFA help?
Send your dataset, questionnaire items, research objectives, software preference, SPSS output or .sav file, supervisor feedback, required tables, deadline, and formatting instructions.
Order Exploratory Factor Analysis Help
Now that Exploratory Factor Analysis Explained has shown how EFA works, you may need professional support applying it to your own dataset. StatisticalAnalysisHelp.com can help with EFA suitability checks, KMO, Bartlett’s test, extraction, rotation, factor loading interpretation, item removal decisions, reliability analysis, APA-style reporting, and supervisor feedback correction.
Send your dataset, questionnaire items, research objectives, software preference, SPSS output or .sav file, supervisor feedback, required tables, deadline, and formatting instructions. We can help you move from confusing EFA output to a clear, defensible, report-ready results section.