How to Run a Moderation Analysis in SPSS
Moderation analysis is useful when a study goes beyond a simple relationship between two variables and starts asking whether that relationship changes under different conditions. In many research projects, the main question is not only whether one variable affects another. The stronger question is whether that effect becomes stronger, weaker, or different depending on a third variable.
This comes up often in business, education, psychology, nursing, public health, and social science research. A predictor may matter more for one group than another. A relationship that looks weak in the full sample may become much clearer once the right moderator is added. A finding that first appears simple can become far more meaningful when the analysis shows that the effect depends on context.
That is one reason moderation analysis matters in SPSS. It helps explain differences that a basic regression model may miss. Instead of treating the effect of one variable on another as fixed, moderation analysis tests whether the effect changes across levels of another variable. This makes the results more realistic and often more useful in real research settings.
Many students reach this point with their data already entered, their variables already chosen, and their topic already approved, but the analysis still feels difficult. The challenge is often not the software alone. The harder part is knowing how to build the model correctly, how to read the interaction term, and how to explain the result in a way that sounds clear and academic. For wider support around this stage, readers may also find SPSS Analysis Help, SPSS Help for Students, Regression Analysis Help, and SPSS Dissertation Help useful.
What moderation analysis means
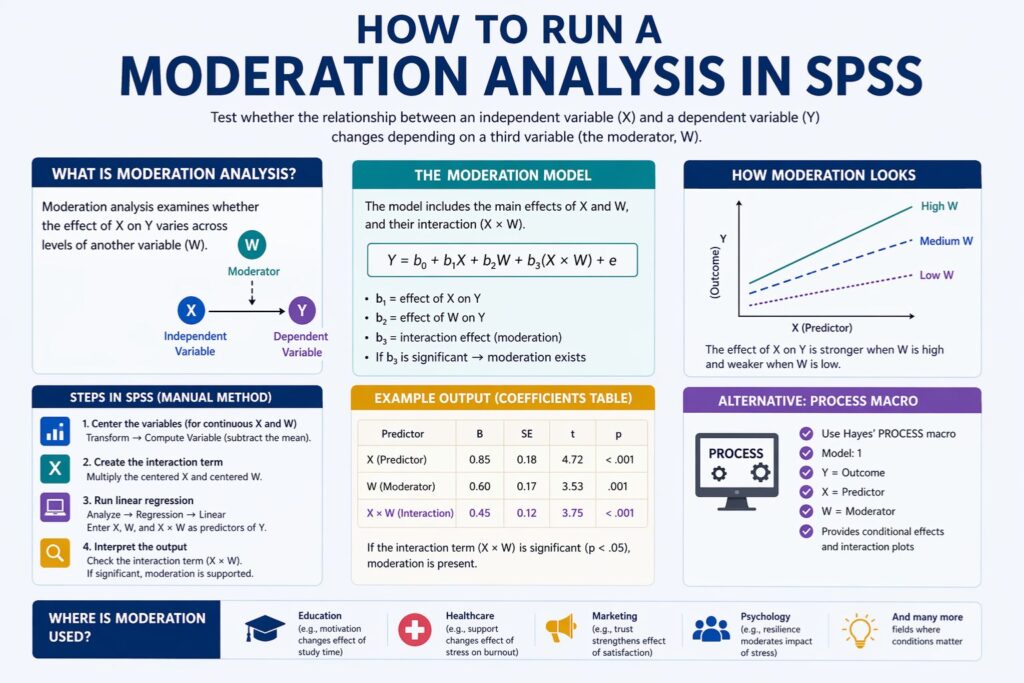
Moderation analysis tests whether the relationship between an independent variable and a dependent variable changes depending on another variable, called the moderator. In plain words, the moderator changes how strongly the predictor affects the outcome.
For example, study time may improve exam performance, but the effect may be much stronger for students with high motivation than for students with low motivation. Job stress may predict burnout, but the effect may be weaker for workers with strong social support. Customer satisfaction may improve loyalty, but that effect may become stronger when trust is high. These are moderation questions because the relationship is not treated as constant.
The key part of moderation analysis is the interaction term. This is the product of the predictor and the moderator. If that interaction term is statistically significant, it means the effect of the predictor on the outcome changes across levels of the moderator. That is the evidence used to conclude that moderation exists.
| Component | Meaning | Example |
|---|---|---|
| Independent variable (X) | Main predictor | Study time |
| Dependent variable (Y) | Outcome variable | Exam score |
| Moderator (W) | Variable that changes the relationship | Motivation |
| Interaction term (X × W) | Product term used to test moderation | Study time × motivation |
This kind of analysis is valuable because many real-world relationships do not work the same way for everyone. A factor that matters in one setting may matter less in another. A program that works well for one group may not work the same way for another group.
- Mediation asks how or why the effect occurs.
That difference changes both the statistical setup and the interpretation. In moderation, the third variable changes the relationship between X and Y. In mediation, the third variable explains the pathway through which X affects Y. A study focused on an interaction term belongs under moderation. A study focused on indirect effects belongs under mediation.
| Aspect | Moderation | Mediation |
|---|---|---|
| Main question | When or for whom does X affect Y? | How or why does X affect Y? |
| Role of third variable | Changes the strength or direction of the relationship | Explains the pathway of the relationship |
| Main evidence | Interaction term | Indirect effect |
| Main interpretation | The effect depends on another variable | The effect works through another variable |
If a reader is working with indirect effects instead, the separate page on How to Run a Mediation Analysis in SPSS fits that topic better. Keeping the two topics separate also helps the site avoid keyword overlap and keeps this page focused on what people searching for moderation analysis in SPSS actually want.
When moderation analysis should be used
Moderation analysis is the right choice when a study expects that a relationship is conditional rather than constant. This usually appears in the wording of the hypothesis or research question. Common signs include phrases such as depends on, varies by, becomes stronger when, becomes weaker when, differs across groups, or changes under certain conditions.
Education research may explore whether study habits influence academic performance differently depending on prior knowledge or motivation. Nursing studies often look at whether workplace support changes the link between stress and burnout. Marketing research may examine whether trust strengthens the connection between customer satisfaction and loyalty. Health research can also assess whether treatment effects differ by age, adherence, or lifestyle.
These are all moderation situations because the main interest is not only whether one variable predicts another. The deeper interest is whether that predictive relationship changes when another factor is present. This often makes the final results more useful because it shows that the same intervention, condition, or behavior does not affect everyone in the same way.
Moderation is especially valuable in dissertations and thesis work because it can strengthen the results and discussion chapters. A simple regression may show whether a variable matters. A moderation model can show when it matters most, when it matters least, and which condition changes the effect. That gives the researcher more to discuss and often leads to more meaningful conclusions.
Preparing the data before running moderation analysis
A good moderation model begins with well-prepared data. The variables should be clearly defined and connected directly to the study objectives. Weak variable setup can make the entire analysis harder to defend, even if the software produces significant results.
The dependent variable is often continuous when ordinary least squares regression is used in SPSS. The independent variable and moderator can be continuous or categorical, but they need to be handled carefully. If both the predictor and moderator are continuous, they are often centered before the interaction term is created. Centering means subtracting the mean from each score. This does not change whether the interaction is significant, but it makes the coefficients easier to interpret and helps reduce unnecessary multicollinearity.
If the moderator is categorical, the coding must be clear. Binary moderators are often coded as 0 and 1 because this makes the output easier to interpret. If a moderator has more than two categories, extra care is needed so the model reflects the categories properly.
It is also important to review missing data, descriptive results, and unusual cases before building the moderation model. Problems in the dataset can weaken the credibility of the analysis later on. Readers who need more support at this stage may also find Data Analysis Help and How to Interpret SPSS Output helpful.
| Preparation step | Why it matters |
|---|---|
| Check variable coding | Poor coding leads to weak interpretation |
| Review missing data | Missing values can affect model quality |
| Center continuous variables | Makes coefficients easier to interpret |
| Create the interaction term | This is the direct test of moderation |
| Review descriptive statistics | Confirms the variables behave as expected |
| Check for unusual cases | Helps avoid distorted results |
Careful preparation saves time later. It also makes the output easier to understand and the write-up easier to defend.
Assumptions to check before interpreting the model
Moderation analysis in SPSS follows the assumptions of multiple regression. These assumptions still matter even when the main interest is the interaction term.
The relationship between the predictors and the outcome should be reasonably linear. The residuals should not show serious normality problems. The variance of the residuals should be reasonably constant. Observations should be independent. Multicollinearity should not be excessive. Outliers and influential points should also be checked because they can distort the coefficients.
Multicollinearity is especially important in moderation analysis because the interaction term is built from other variables. This can raise correlations among predictors. That is one reason centering is often recommended when the predictor and moderator are continuous.
These checks matter because a significant interaction is stronger when the rest of the model is also sound. A result is harder to trust when the coding is poor, the residuals show serious problems, or extreme cases are shaping the model too heavily. For readers who want more help with this part, How to Interpret SPSS Output and How to Report Regression Results in APA Format connect well with this topic.
How to run a moderation analysis in SPSS manually
The manual method is one of the clearest ways to understand moderation because each step is visible. It helps show how the model is built and why the interaction term matters.
Step 1: Identify the variables
Start by deciding which variable is the independent variable, which is the dependent variable, and which is the moderator. This should come from the study objectives, research questions, and theory. The model should reflect the logic of the study, not random experimentation after looking at the data.
For example, if the study asks whether the effect of study time on exam score depends on motivation, then study time is the predictor, exam score is the outcome, and motivation is the moderator.
Step 2: Center the continuous variables
If the predictor and moderator are both continuous, create centered versions of them in SPSS.
Go to:
Transform > Compute Variable
Then subtract the mean from each variable.
Examples:
- Centered study time = study time − mean study time
- Centered motivation = motivation − mean motivation
This helps interpretation because the main effects become easier to understand.
Step 3: Create the interaction term
Still under Transform > Compute Variable, multiply the centered predictor by the centered moderator.
Example:
- Interaction = centered study time × centered motivation
This product term is the interaction term. It is the main test of moderation.
Step 4: Run the regression model
Go to:
Analyze > Regression > Linear
Then:
- place the dependent variable in the dependent box
- place the predictor, moderator, and interaction term in the independent variables box
- add any control variables if the research design requires them
This produces the main output tables needed for interpretation.
Step 5: Focus on the coefficients table
The coefficients table is the most important part of the output for moderation.
If the interaction term is significant, moderation is supported.
If the interaction term is not significant, there is no statistical evidence that the predictor-outcome relationship changes across levels of the moderator in that model.
Step 6: Explain the pattern of the interaction
A good interpretation goes beyond the p value. It should explain what changes and in what direction.
Questions to answer include:
- Does the relationship become stronger at higher levels of the moderator?
- Does it become weaker?
- Does it only appear clearly in one group?
- Does the direction of the relationship change?
| Step | SPSS action | Outcome |
|---|---|---|
| Identify variables | Define X, Y, and W | Clear model structure |
| Center variables | Transform > Compute Variable | Centered variables |
| Create interaction term | Transform > Compute Variable | X × W variable |
| Run regression | Analyze > Regression > Linear | Output tables |
| Interpret interaction | Review coefficients | Evidence for moderation |
This manual method is useful for assignments and dissertations where the researcher wants to understand each stage clearly rather than relying only on automated output.
How to run a moderation analysis in SPSS using PROCESS
Many researchers prefer PROCESS because it simplifies moderation analysis and often gives cleaner output for interpretation. For simple moderation, the common option is Model 1.
In PROCESS:
- Y is the dependent variable
- X is the independent variable
- W is the moderator
Once the variables are entered and Model 1 is selected, the analysis can be run with useful options such as conditional effects and interaction output. This is often helpful because PROCESS does more than show whether the interaction is significant. It also helps explain how the predictor behaves at different levels of the moderator.
This makes PROCESS especially useful when the results section needs to show more than one number. It allows the analysis to move from “the interaction is significant” to “the effect is stronger when the moderator is high and weaker when the moderator is low.” That is often the part readers, supervisors, and examiners want to see clearly.
| PROCESS field | What to enter |
|---|---|
| Y | Dependent variable |
| X | Independent variable |
| W | Moderator |
| Model number | 1 |
| Helpful options | Conditional effects, interaction details, centering, plots |
Readers working more broadly with regression models may also want to see Regression Analysis Help alongside this topic.
How to interpret moderation output in SPSS
SPSS produces several tables, but the interpretation becomes easier once attention stays on the main ones.
The Model Summary table gives values such as R, R², and adjusted R². This shows how much of the variation in the dependent variable is explained by the model.
The ANOVA table shows whether the model as a whole is significant.
The Coefficients table is the most important because it includes the main effects and the interaction term. The interaction line is what determines whether moderation exists.
If PROCESS is used, the conditional effects output is also very useful because it shows how the effect of the predictor changes at low, average, and high levels of the moderator.
| Output table | Meaning | Why it matters |
|---|---|---|
| Model Summary | Overall fit of the model | Shows how much variation the model explains |
| ANOVA | Overall significance | Shows whether the model predicts the outcome |
| Coefficients | Main effects and interaction | Shows whether moderation exists |
| Conditional effects | Effect of X at different moderator levels | Shows how the relationship changes |
A good interpretation does not stop after saying the interaction is significant. It should explain the pattern in plain language. If the effect of study time on exam scores becomes stronger when motivation is high, that should be stated clearly. If social support weakens the effect of stress on burnout, that should also be made clear in the results.
Example moderation results table
Below is a simple example of how moderation results can be presented.
| Predictor | B | SE | t | p | Interpretation |
|---|---|---|---|---|---|
| Study time | 2.14 | 0.48 | 4.46 | < .001 | More study time predicts higher exam scores |
| Motivation | 1.08 | 0.36 | 3.00 | .003 | Higher motivation is linked to better exam scores |
| Study time × motivation | 0.72 | 0.21 | 3.43 | .001 | Motivation changes the effect of study time on exam scores |
In this example, the interaction term is significant. That means the relationship between study time and exam scores depends on motivation. The positive coefficient suggests that the effect becomes stronger as motivation increases.
Example conditional effects table
When the interaction is significant, it helps to show how the predictor behaves at different levels of the moderator.
| Moderator level | Effect of X on Y | SE | t | p | Meaning |
|---|---|---|---|---|---|
| Low motivation | 1.22 | 0.41 | 2.98 | .004 | Study time improves scores, but the effect is smaller |
| Average motivation | 2.14 | 0.48 | 4.46 | < .001 | The effect is clearer at average motivation |
| High motivation | 3.06 | 0.55 | 5.56 | < .001 | The effect is strongest when motivation is high |
This kind of table helps the results section feel complete because it shows the pattern, not just the significance.
How to write the moderation result in words
A strong write-up should explain both the statistics and the meaning.
Example:
A moderation analysis was conducted to test whether motivation changed the relationship between study time and exam scores. The interaction between study time and motivation was significant, b = 0.72, SE = 0.21, t = 3.43, p = .001, indicating that the effect of study time on exam scores depended on motivation level. Conditional effects showed that study time had a stronger positive association with exam scores at higher levels of motivation than at lower levels of motivation.
This kind of reporting is stronger because it does not leave the reader with a number alone. It explains what changed and how the moderator shaped the relationship. Readers who need help polishing this stage may also benefit from How to Report Regression Results in APA Format and How to Interpret SPSS Output.
Common mistakes in moderation analysis
Many weak moderation write-ups come from interpretation problems rather than software problems.
One common mistake is confusing moderation with mediation. Another is forgetting to create the interaction term and then discussing only the main effects. Some researchers create the interaction term but do not center continuous variables, making the coefficients harder to explain. Others report that the interaction is significant but never show what that means in practice.
Assumptions are also often ignored. A significant interaction becomes much less convincing if the model is built on poor coding, serious outliers, or strong multicollinearity that was never checked. A strong moderation analysis should be statistically correct and clearly explained.
Why moderation analysis matters in real research
Moderation matters because real relationships are rarely identical across all people and settings. The same predictor can matter more for one group and less for another. The same treatment can work better under one condition than another. A variable that looks weak in the overall sample may become highly important when the right moderator is introduced.
This is one reason moderation often improves the quality of a results chapter. It adds depth to the analysis and makes the conclusions more realistic. Instead of saying only that a relationship exists, the researcher can explain when the relationship becomes stronger, when it becomes weaker, and which condition changes the pattern. That makes the findings more useful for discussion and recommendation.
Help with moderation analysis in SPSS
Many students get to this stage with their data ready but still feel unsure about the next step. Some are not certain whether the third variable should be treated as a moderator. Some have already run the model in SPSS but do not know how to explain the interaction term clearly. Others have output on the page in front of them, but the results section still feels weak and unfinished.
This is usually where the real difficulty begins. Running the test is one part of the work, but explaining what the result means is often harder. A significant interaction needs to be written in a way that is clear, accurate, and connected to the study question. The same applies when the interaction is not significant. The result still needs to be presented properly and discussed in a way that makes sense.
Some projects need help with the full analysis. Others only need help with interpretation, reporting, or checking whether the model was set up correctly. Students working on moderation analysis often need more than one kind of support. Some may need help with the full statistical process, while others may only need help interpreting the output or improving the results section. In those cases, pages such as Data Analysis Help, SPSS Help for Students, SPSS Analysis Help, Regression Analysis Help, and SPSS Dissertation Help are closely related. Readers who want clearer guidance on output and reporting may also find How to Interpret SPSS Output and How to Report Regression Results in APA Format helpful. For direct support with a current project, Request Quotes Now.
Frequently asked questions
What is moderation analysis in SPSS?
Moderation analysis in SPSS tests whether the relationship between an independent variable and a dependent variable changes depending on another variable.
What shows that moderation exists?
The key test is the interaction term. If the interaction term is statistically significant, moderation is supported.
Do I need to center variables before running moderation in SPSS?
If the predictor and moderator are continuous, centering is often recommended because it improves interpretation and helps reduce unnecessary multicollinearity.
Which PROCESS model is used for simple moderation?
Model 1 is commonly used for simple moderation.
What if the interaction term is not significant?
If the interaction term is not significant, there is no statistical evidence that the relationship changes across levels of the moderator in that model.
Can I use a categorical moderator?
Yes. A categorical moderator can be used, but it should be coded clearly so the output is easy to interpret.
Which table matters most in moderation analysis?
The coefficients table is usually the most important because it contains the interaction term, which is the direct test of moderation.
How should moderation results be reported?
A good report should include the interaction coefficient, standard error, test statistic, p value, and a clear explanation of how the relationship changes.