
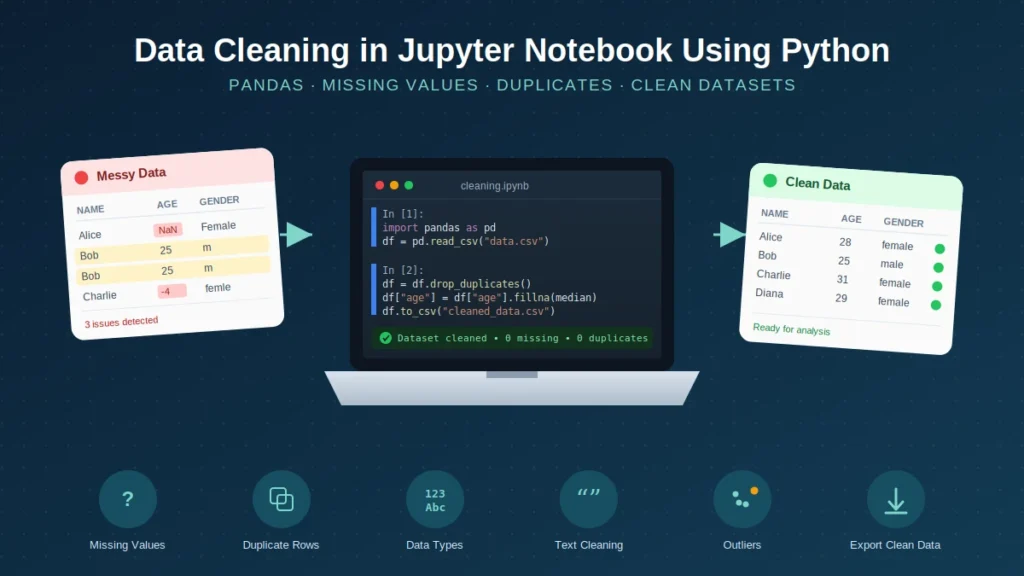
If you have ever opened a “ready” dataset and found blank cells, repeated rows, three different spellings of the same category, and a date column that refuses to sort correctly, you already know why learning how to clean data in Jupyter Notebook matters. Most raw datasets, whether they come from a survey platform, a CRM export, a hospital record system, or a public data portal, look usable at first glance but break down the moment you try to run a real analysis.
Messy data doesn’t just slow you down. It quietly distorts descriptive statistics, throws off regression models, produces misleading dashboards, weakens dissertation results, skews survey findings, and confuses machine learning models before they even start training. A single unhandled missing-value code, an unnoticed duplicate ID, or a text column with inconsistent capitalization can change your conclusions without ever throwing an error.
Whether you are cleaning data for a class assignment, a dissertation chapter, a client report, or a production dashboard, the same core discipline applies: inspect before you act, document every decision, and never clean blindly. And if your notebook is throwing errors or your dataset is too messy to handle alone, our team can step in. More on that below.
Need Help Cleaning Data in Jupyter Notebook?
Not every dataset can be cleaned with a quick tutorial, and not every deadline allows time to debug Pandas errors line by line. If you need hands-on help, you can send us your Jupyter Notebook, Python script, CSV file, Excel file, SPSS file, survey export, dissertation dataset, business dataset, assignment instructions, supervisor comments, or analysis requirements.
Our team at StatisticalAnalysisHelp.com works with Python and Pandas to clean messy datasets, document every cleaning step, fix broken code, prepare analysis-ready files, and export cleaned datasets formatted for SPSS, Excel, R, Stata, Power BI, Tableau, or machine learning workflows. Whether your data comes from a survey tool, a business system, or a research instrument, we adapt the cleaning process to your variables, your codebook, and your analysis goals.
Request a Quote Now for Jupyter Notebook data cleaning, Pandas code support, dataset preparation, and analysis-ready reporting.
How Do You Clean Data in Jupyter Notebook?
In short, cleaning data in Jupyter Notebook follows a repeatable sequence:
- Open or create a Jupyter Notebook.
- Import Pandas.
- Load the dataset from CSV, Excel, or another file.
- Inspect the dataset using
.head(),.info(),.shape(), and.describe(). - Check missing values using
.isna().sum(). - Handle missing values using
dropna(),fillna(), or column-specific methods. - Check duplicates using
.duplicated().sum(). - Remove duplicates using
.drop_duplicates(). - Fix data types using
astype()orpd.to_datetime(). - Clean text using
.str.strip(),.str.lower(), and.str.replace(). - Standardize categories.
- Detect invalid values and outliers.
- Rename columns.
- Validate the cleaned dataset.
- Export the cleaned file using
.to_csv()or.to_excel().
Here is the same process as a quick-reference table:
| Step | Pandas Action | Purpose |
|---|---|---|
| Import Pandas | import pandas as pd |
Load the main data-cleaning library |
| Load data | pd.read_csv() or pd.read_excel() |
Bring the dataset into Jupyter Notebook |
| Inspect data | .head(), .info(), .shape() |
Understand rows, columns, and data types |
| Check missing values | .isna().sum() |
Find incomplete fields |
| Remove duplicates | .drop_duplicates() |
Remove repeated rows |
| Fix data types | astype(), pd.to_datetime() |
Prepare variables for analysis |
| Clean text | .str.strip(), .str.lower() |
Standardize messy text |
| Export data | .to_csv() or .to_excel() |
Save the clean dataset |
If your Python notebook gives errors or your dataset is too messy to clean alone, Request a Quote Now for data cleaning help.
What Is Data Cleaning in Jupyter Notebook?
Data cleaning means identifying and fixing problems in a dataset before it is used for analysis, reporting, or modeling. In Jupyter Notebook, this happens step by step, inside code cells, where you can see the raw data, run a cleaning operation, and immediately check the result.
Pandas is the library most commonly used for this work because it is built around the DataFrame, a table-like structure that makes it easy to inspect, filter, transform, and reshape data using readable code.
Data cleaning in Jupyter Notebook typically prepares a dataset for:
- Descriptive and inferential statistics
- Data visualization and dashboards
- Survey and research analysis
- Business intelligence reporting
- Machine learning model training
What makes Jupyter Notebook especially useful for this work is that it combines code, output, tables, charts, and written explanation in a single document. That means your cleaning process isn’t just a set of commands, it becomes a readable record of every decision you made, which matters enormously when someone else (a supervisor, collaborator, or reviewer) needs to understand what changed between the raw file and the final dataset.
Why Clean Data Before Analysis?
Skipping data cleaning doesn’t save time, it just moves the problem downstream, usually to a point where it’s harder to fix.
Here is what unclean data actually does to your results:
- Missing values can distort summary statistics, shrink your effective sample size, or bias your estimates depending on why the data is missing.
- Duplicates can inflate your sample size and make your findings look more statistically robust than they really are.
- Wrong data types can silently break analysis functions or force numeric variables to be treated as text.
- Inconsistent categories can create false subgroups, for example, treating “Female,” “female,” and “F” as three separate groups instead of one.
- Invalid values such as ages below zero, percentages above 100, or Likert scores outside the valid range can produce conclusions that don’t reflect reality.
- Outliers can pull means, distort regression coefficients, and stretch chart axes so far that real patterns become invisible.
- Messy column names with spaces, punctuation, or inconsistent casing create avoidable coding errors.
- Unclean survey exports with instructional text, duplicate headers, or inconsistent response coding can make an entire dataset unreliable if left untouched.
A simple example makes this concrete: a dataset may record “Female,” “female,” “F,” and “femle” as four different categories unless the values are standardized. Left uncorrected, a simple frequency count would report four groups instead of one, and any cross-tabulation or chi-square test built on that variable would be wrong from the start. This matters because the payoff of clean data is everything downstream of it: reliable quantitative data analysis, regression analysis results you can actually trust, and hypothesis testing that reflects your real data rather than an artifact of messy inputs.
For complex or urgent datasets, our Data Cleaning Services can help prepare clean, analysis-ready files before statistical analysis.
What You Need Before Cleaning Data in Jupyter Notebook
Before writing any cleaning code, make sure you have the right setup in place:
- Python installed locally or through Anaconda
- Jupyter Notebook or JupyterLab
- Pandas installed (
pip install pandasif it isn’t already) - Your dataset in CSV, Excel, TXT, JSON, or another supported format
- A codebook or data dictionary, where available
- A clear understanding of your variables, ID fields, missing-value codes, and analysis goals
import pandas as pd
import numpy as np
NumPy is useful alongside Pandas for handling missing values, performing numerical operations, and writing conditional cleaning logic, for example, flagging values that fall outside an expected range. If you’re working through a broader coursework project rather than a standalone cleaning task, our Python assignment help and data science assignment help teams can support the coding side of the assignment as well.
Step 1: Load Your Dataset in Jupyter Notebook
The first practical step is getting your file into a Pandas DataFrame.
CSV example:
import pandas as pd

df = pd.read_csv("data.csv")
df.head()
Excel example:
df = pd.read_excel("data.xlsx")
df.head()
A few things to keep in mind:
dfis simply the variable name holding your DataFrame, you can call it anything, butdfis the common convention..head()displays the first five rows so you can confirm the file loaded correctly.- The file path must match exactly where the file is saved, including the extension.
- On Windows, use a raw string for file paths to avoid backslash errors:
df = pd.read_csv(r"C:\Users\YourName\Documents\data.csv")Step 2: Inspect the Dataset
Cleaning should always begin with inspection, not with deleting or changing values. You need to understand what you’re working with before you touch anything.
df.shape
df.head()
df.info()
df.describe()
df.columns
What each of these tells you:
.shapereturns the number of rows and columns..head()previews the first rows of data..info()shows data types and non-missing counts for each column..describe()summarizes numeric variables (mean, min, max, quartiles)..columnslists all column names.
If the number of rows is lower or higher than you expected, stop and check whether the file imported correctly before moving forward, a wrong delimiter, an extra header row, or a partial file load are common culprits.
Step 3: Clean Column Names
Messy column names are one of the most common sources of avoidable coding errors. They often include extra spaces, inconsistent capitalization, punctuation, hidden characters, or long labels copied directly from a survey export tool.
df.columns = (
    df.columns
    .str.strip()
    .str.lower()
    .str.replace(" ", "_")
    .str.replace("-", "_")
)
This single block strips whitespace, lowercases everything, and replaces spaces and hyphens with underscores. So a column originally labeled Customer Name becomes customer_name, easier to type, easier to reference in code, and far less likely to cause a KeyError later in your notebook.
Step 4: Check Missing Values in Python
Once your dataset is loaded and your column names are clean, the next step is understanding where data is missing.
df.isna().sum()To see missingness as a percentage rather than a raw count:
missing_percent = df.isna().mean() * 100
missing_percent.sort_values(ascending=False)
Here, .isna() flags missing cells, .sum() counts them per column, and .mean() * 100 converts that count into a percentage of the total rows.
Missing values should never be handled blindly. The right approach depends on which variable is missing, how much of it is missing, your research design, and what the missing data will be used for. A variable missing 2% of its values calls for a very different decision than one missing 40%.
Step 5: Handle Missing Data in Python
There are three broad approaches, and the right one depends on context.
Option 1: Drop rows with any missing values
df_clean = df.dropna()This can be acceptable when missingness is minimal and random, but risky when it removes a large share of your sample or systematically drops certain kinds of respondents or records.
Option 2: Drop rows missing only key variables
df_clean = df.dropna(subset=["age", "income"])This is often a better choice when only certain variables are essential to your analysis, letting you keep rows with missing data in less important columns.
Option 3: Fill missing values
Mean fill:
df["age"] = df["age"].fillna(df["age"].mean())Median fill (often better for skewed variables like income):
df["income"] = df["income"].fillna(df["income"].median())Category fill:
df["department"] = df["department"].fillna("Unknown")Any imputation choice should be justified and documented, especially in research and dissertation work, where a methods section or reviewer may ask exactly how missing data was handled and why.
A quick but important warning: do not replace missing values with zero unless zero is a genuinely meaningful value for that variable. Filling missing income or age with zero, for example, will badly distort your statistics.
Step 6: Find and Remove Duplicates in Pandas
Duplicate rows can come from data entry errors, repeated form submissions, or file merges gone wrong.
Count duplicates:
df.duplicated().sum()View the duplicate rows themselves:
df[df.duplicated()]Remove exact duplicate rows:
df_clean = df.drop_duplicates()Remove duplicates based on a specific ID column:
df_clean = df.drop_duplicates(subset=["participant_id"], keep="first")drop_duplicates()removes rows that are exact repeats.subsettells Pandas to check for duplicates using only the specified columns.keep="first"keeps the first occurrence of a duplicate and drops the rest.keep="last"keeps the last occurrence instead.
Be careful here: do not remove duplicates automatically if repeated rows actually represent repeated measures, multiple clinic visits, multiple transactions, or time-point data in a longitudinal design. In those cases, what looks like a duplicate is actually valid, meaningful data. If duplicate IDs appear after combining files, you may also need to review file matching and merging rules, especially when preparing data for SPSS. See our guide on how to merge files in SPSS.
Step 7: Fix Data Types
Wrong data types are one of the most common reasons Pandas code throws confusing errors partway through an analysis.
Common problems include:
- Numeric columns imported as text
- Dates imported as generic objects instead of datetime values
- ID numbers losing their leading zeros
- Currency symbols preventing numeric conversion
- Percentages stored as strings
df["age"] = pd.to_numeric(df["age"], errors="coerce")
df["date"] = pd.to_datetime(df["date"], errors="coerce")
df["participant_id"] = df["participant_id"].astype(str)pd.to_numeric()converts a column to numeric values.errors="coerce"turns any value that can’t be converted into a missing value, instead of crashing the whole operation.pd.to_datetime()converts date-like text into proper datetime objects Pandas can sort and calculate with.- ID columns should usually stay as strings, particularly when leading zeros are part of the ID’s meaning.
Step 8: Clean Text Columns
Text columns are often the messiest part of any dataset, especially in survey data and manually entered records.
Common problems include extra spaces, mixed case, typos, inconsistent labels, hidden characters, and multiple spellings for the same category.
df["gender"] = df["gender"].str.strip().str.lower()Replace inconsistent category values directly:
df["gender"] = df["gender"].replace({
    "m": "male",
    "male ": "male",
    "f": "female",
    "femle": "female"
})
To clean every text column at once:
text_columns = df.select_dtypes(include="object").columns

for col in text_columns:
    df[col] = df[col].str.strip()
This kind of text cleaning matters most for survey data, customer records, demographic variables, and any category that will be summarized or cross-tabulated later.
Step 9: Standardize Categories
Even after basic text cleaning, categorical variables often still contain inconsistent labels that create false subgroups.
df["education_level"].value_counts()

df["education_level"] = df["education_level"].replace({
    "Bachelor": "bachelor",
    "bachelors": "bachelor",
    "BA": "bachelor",
    "BSc": "bachelor"
})
Always run .value_counts() both before and after standardization. It’s the fastest way to confirm that your replacement mapping actually covers every inconsistent variant in the column, it’s easy to miss one and leave a stray category behind.
Step 10: Detect Invalid Values
Invalid values are entries that fall outside what’s logically possible, even if they look like normal numbers at first glance.
Examples include:
- Age below 0
- Scores outside the allowed scale
- Negative income where that’s impossible
- Dates set in the future
- Percentages above 100
- Likert-scale values outside the expected 1–5 range
df[df["age"] < 0]
df[df["score"] > 100]
df[~df["likert_item"].between(1, 5)]
Invalid values should be reviewed individually where possible, corrected if the correct value can be determined, flagged for follow-up, or set to missing when there’s no reliable way to fix them, but that decision should always be documented.
Step 11: Detect and Handle Outliers
Outliers are extreme values that sit far from the rest of the distribution. One common way to flag them is the interquartile range (IQR) method:
q1 = df["income"].quantile(0.25)
q3 = df["income"].quantile(0.75)
iqr = q3 - q1

lower_bound = q1 - 1.5 * iqr
upper_bound = q3 + 1.5 * iqr

outliers = df[(df["income"] < lower_bound) | (df["income"] > upper_bound)]
outliers
A few important things to keep in mind about outliers:
- They are not automatically errors, some represent genuine extreme cases.
- They should not be deleted automatically without review.
- Any decision to remove, adjust, or keep them should be documented.
- Outliers can meaningfully affect means, regression coefficients, visualizations, and machine learning models.
If capping is appropriate for your analysis, you can limit extreme values without deleting rows:
df["income_capped"] = df["income"].clip(lower_bound, upper_bound)Capping should only be used when it fits your analysis goals, and the decision should be clearly documented alongside your other cleaning steps.
Step 12: Create Derived or Cleaned Variables
Once the raw variables are clean, you may need to build new variables for analysis.
Create an age group variable:
df["age_group"] = pd.cut(
    df["age"],
    bins=[0, 29, 44, 59, 100],
    labels=["18-29", "30-44", "45-59", "60+"]
)
Create a total scale score:
scale_items = ["q1", "q2", "q3", "q4"]
df["total_score"] = df[scale_items].sum(axis=1)
Create an average scale score:
df["mean_score"] = df[scale_items].mean(axis=1)When creating scale or survey scores, always follow the scoring rules laid out in the original questionnaire, including any reverse-coded items, rather than assuming a simple sum or average is correct. For more complex survey instruments, see our survey data analysis help resources.
Step 13: Validate the Cleaned Dataset
Cleaning isn’t finished until you’ve confirmed the results.
df_clean.info()
df_clean.isna().sum()
df_clean.duplicated().sum()
df_clean.describe()
df_clean.head()
Running these checks again after cleaning confirms whether missing values, duplicates, invalid entries, and incorrect data types were actually resolved, not just addressed in theory. Skipping this step is how cleaning mistakes make it all the way into a final analysis. Once your dataset passes validation, it’s ready to move into the analysis stage itself, whether that means our data analysis help team or more specialized statistical data analysis help support.
Step 14: Export the Cleaned Dataset
Once validated, save your cleaned dataset as a separate file.
CSV export:
df_clean.to_csv("cleaned_data.csv", index=False)Excel export:
df_clean.to_excel("cleaned_data.xlsx", index=False)A few habits worth keeping:
index=Falseprevents Pandas from adding an unwanted extra index column to your exported file.- Always keep both the original raw file and the cleaned file, never overwrite your raw data.
- Keep a written record of your cleaning steps alongside the files, even if it’s just a short notes section in the notebook itself.
Full Data Cleaning Example in Jupyter Notebook
Here’s a complete, beginner-friendly example that ties every step together using a small, deliberately messy DataFrame.
import pandas as pd
import numpy as np

data = {
    "Customer Name": [" Alice ", "Bob", "Charlie", "Alice ", "Diana"],
    "Age": [25, np.nan, 31, 25, -4],
    "Gender": ["Female", "M", "male", "female ", "F"],
    "Score": [88, 92, np.nan, 88, 105]
}

df = pd.DataFrame(data)
df
Now the cleaning steps:
df.columns = (
    df.columns
    .str.strip()
    .str.lower()
    .str.replace(" ", "_")
)

df["customer_name"] = df["customer_name"].str.strip()

df["gender"] = df["gender"].str.strip().str.lower()
df["gender"] = df["gender"].replace({
    "m": "male",
    "f": "female"
})

df["age"] = pd.to_numeric(df["age"], errors="coerce")
df.loc[df["age"] < 0, "age"] = np.nan

df["score"] = pd.to_numeric(df["score"], errors="coerce")
df.loc[~df["score"].between(0, 100), "score"] = np.nan

df = df.drop_duplicates()

df["age"] = df["age"].fillna(df["age"].median())
df["score"] = df["score"].fillna(df["score"].median())

df
In plain language: the column names are standardized first, then the customer name field is trimmed of stray spaces, gender values are lowercased and mapped to two consistent categories, invalid ages and out-of-range scores are converted to missing, exact duplicate rows are dropped, and finally the remaining missing values in age and score are filled using the median. What started as a five-row table with inconsistent labels, a negative age, an out-of-range score, and a duplicate customer ends up as a clean, four-row dataset ready for analysis.
Data Cleaning Checklist for Jupyter Notebook
Use this as a quick reference for every new dataset:
- Load the raw dataset
- Preview rows and columns
- Check data shape
- Review data types
- Clean column names
- Check missing values
- Decide how to handle missing data
- Identify duplicates
- Review duplicate IDs before removing rows
- Fix numeric, text, and date variables
- Standardize categories
- Check invalid values
- Detect outliers
- Create cleaned variables where needed
- Validate the cleaned dataset
- Save the cleaned file
- Keep the raw file unchanged
- Document cleaning steps
Common Mistakes When Cleaning Data in Jupyter Notebook
- Deleting rows before inspecting missingness. You may remove far more data than necessary, or lose systematic patterns worth understanding first.
- Replacing all missing values with zero. This distorts averages and totals unless zero genuinely represents the missing case.
- Removing duplicates without checking repeated-measures structure. You might delete valid repeated observations instead of true duplicates.
- Treating IDs as numbers when leading zeros matter. This silently strips meaningful characters from identifiers.
- Forgetting to convert date columns. Dates left as text won’t sort or filter correctly.
- Ignoring inconsistent category labels. This creates false subgroups in your analysis.
- Changing values without documentation. Undocumented decisions are difficult to defend or reproduce later.
- Overwriting the raw dataset. Once overwritten, the original data can’t be recovered if a mistake is found.
- Removing outliers automatically. Some outliers are genuine and important to your findings.
- Not checking results after cleaning. Skipping validation means errors can slip through unnoticed.
- Not saving the cleaned dataset separately. This makes it hard to track what changed and when.
- Using code without understanding what it changes. Copying cleaning code without knowing its effect can quietly corrupt your data.
Troubleshooting Python Data Cleaning Problems
| Problem | Likely Cause | Fix |
|---|---|---|
| File not found | Wrong path or filename | Check folder, spelling, and file extension |
| Column not found | Column name has spaces or different capitalization | Run df.columns and clean column names |
| Missing values not detected | Missing values coded as 99, N/A, unknown, or blank text | Replace custom missing codes with np.nan |
| Numeric column stays as object | Currency signs, commas, or text values | Remove symbols and use pd.to_numeric() |
| Dates do not convert | Mixed date formats or invalid dates | Use pd.to_datetime(errors="coerce") |
| Duplicates remain | Duplicate definition depends on selected columns | Use subset= with key columns |
| Outlier code removes too much data | Cutoff not suitable for context | Review outliers before removing or capping |
| Exported file has extra index column | Pandas saved the index | Use index=False |
Data Cleaning for Research, Dissertation, and Survey Projects
Academic and research data cleaning carries a higher bar than a typical business file, because the process needs to hold up to scrutiny later, from a supervisor, a committee, or a peer reviewer.
Keep these principles in mind:
- Preserve the raw dataset exactly as it was collected
- Document every cleaning decision as you make it
- Align variables with your questionnaire or codebook
- Check for reverse-coded items before computing scale scores
- Verify scale scoring against the original instrument
- Handle missing data carefully, with a clear rationale
- Avoid changing values in a way that pushes toward a particular result
- Prepare clean files formatted correctly for SPSS, R, Stata, or Python analysis
- Keep transparent notes you can reference in a methods or results section
If you’re working on a dissertation or thesis dataset and want a second set of eyes on your cleaning process, our dissertation data analysis help team can review or handle this stage for you.
Data Cleaning for Business and Dashboard Projects
Business datasets bring their own recurring cleaning challenges, usually tied to how the data was generated across different systems:
- CRM records with duplicate or incomplete contacts
- Sales data with inconsistent product naming
- Customer data pulled from multiple sources
- Product catalogs with mismatched categories
- KPI reports built on inconsistent time periods
- Transaction records with formatting differences
- Monthly reports combined from separate files
- Dashboard source files feeding Power BI or Tableau
Getting this right before the data reaches a dashboard is far easier than fixing a dashboard that’s already built on flawed numbers. Our data visualization services team can help prepare business data specifically for dashboard and reporting use.
How We Help With Jupyter Notebook Data Cleaning
If you’d rather have this handled for you, or just need a second opinion on a dataset that’s giving you trouble, StatisticalAnalysisHelp.com can help with:
- Cleaning CSV and Excel datasets in Jupyter Notebook
- Writing Pandas data cleaning code
- Fixing Python errors
- Handling missing values
- Removing duplicates correctly
- Cleaning text and category variables
- Fixing data types and date variables
- Detecting invalid values
- Reviewing outliers
- Creating cleaned variables
- Preparing clean datasets for analysis
- Documenting cleaning steps
- Exporting clean files
- Preparing data for SPSS, R, Stata, Excel, Power BI, Tableau, or machine learning
Request a Quote Now for Python data cleaning, Jupyter Notebook support, Pandas code help, and clean analysis-ready datasets. If your project goes beyond cleaning into building and evaluating a model, our machine learning assignment help team can pick up from there.
Pricing for Jupyter Notebook Data Cleaning Help
Because every dataset is different, pricing for data cleaning work is quote-based rather than fixed. The final cost depends on a number of factors:
- File type
- Number of files
- Number of rows
- Number of columns
- Amount of missing data
- Duplicate records
- Text cleaning complexity
- Data type problems
- Date-format problems
- Outlier review
- Required code documentation
- Deadline
- Required output format
- Whether analysis or reporting is also needed
| Service Need | What It May Include | Pricing Basis |
|---|---|---|
| Basic Pandas cleaning | Missing values, duplicates, column names | Based on file size and condition |
| Jupyter Notebook cleanup | Code cells, comments, reusable workflow | Based on notebook complexity |
| Survey data cleaning | Likert items, categories, scale scores | Based on questionnaire structure |
| Dissertation data cleaning | Research dataset preparation and documentation | Based on project scope |
| Business data cleaning | CRM, sales, customer, or dashboard files | Based on data source complexity |
| Python error fixing | Debugging Pandas cleaning code | Based on error and code length |
| Urgent data cleaning | Faster turnaround where possible | Based on deadline and workload |
Request a Quote Now by sending your notebook, dataset, instructions, deadline, and required output format.
What You Receive
- Cleaned dataset
- Jupyter Notebook with cleaning code
- Pandas code comments where requested
- Clean CSV or Excel export
- Missing-value summary
- Duplicate-record review
- Corrected data types
- Cleaned column names
- Standardized categories
- Invalid-value notes
- Outlier review where requested
- Cleaned variables or scale scores where appropriate
- Documentation of cleaning steps
- Revision based on agreed feedback
Why Trust StatisticalAnalysisHelp.com?
- Python and Pandas support from people who work with real research and business datasets daily
- Clear explanations alongside the code, not just a cleaned file with no context
- Confidential file handling
- Files used only for the requested project
- Personal identifiers can be removed before sharing
- No fabricated data
- No manipulation designed to force a particular result
- Honest data preparation aimed at valid analysis, not guaranteed outcomes
Your files are handled confidentially and used only for the requested project. Personal identifiers may be removed before sharing the data. If your Jupyter Notebook, dataset, assignment instructions, supervisor comments, or analysis requirements are incomplete, support can still be provided using the available materials.
Frequently Asked Questions About How to Clean Data in Jupyter Notebook
How do I clean data in Jupyter Notebook?
You clean data in Jupyter Notebook by loading your dataset with Pandas, inspecting it with functions like .info() and .describe(), then systematically handling missing values, duplicates, incorrect data types, messy text, and invalid values before exporting the result as a new file.
What library is best for data cleaning in Jupyter Notebook?
Pandas is the standard library for data cleaning in Jupyter Notebook, often paired with NumPy for numerical operations and conditional logic like flagging invalid or out-of-range values.
How do I load a CSV file in Jupyter Notebook?
Use pd.read_csv("filename.csv") after importing Pandas, then check that it loaded correctly with .head() and .shape.
How do I check missing values in Pandas?
Run df.isna().sum() to see missing counts by column, or df.isna().mean() * 100 to see missingness as a percentage.
How do I handle missing data in Python?
You can drop rows with dropna(), drop rows missing specific key variables with dropna(subset=[...]), or fill missing values with fillna() using the mean, median, or a placeholder category, the right choice depends on the variable and your analysis goals.
Should I drop or fill missing values?
It depends on how much data is missing, why it’s missing, and how essential the variable is. Small amounts of random missingness are often safe to drop, while systematic or heavier missingness may call for careful imputation instead.
How do I remove duplicates in Pandas?
Use df.drop_duplicates() for exact duplicate rows, or add a subset parameter to check duplicates based on specific columns, such as an ID field.
How do I remove duplicates based on one column?
Use df.drop_duplicates(subset=["column_name"], keep="first") to remove rows that share the same value in that column, keeping only the first occurrence.
How do I clean column names in Pandas?
Chain string methods on df.columns, such as .str.strip(), .str.lower(), and .str.replace(" ", "_"), to produce consistent, code-friendly column names.
How do I fix data types in Pandas?
Use pd.to_numeric() for numbers, pd.to_datetime() for dates, and .astype(str) for text or ID fields, adding errors="coerce" to convert invalid entries into missing values instead of causing an error.
How do I convert dates in Pandas?
Use pd.to_datetime(df["column"], errors="coerce"), which converts recognizable date formats and turns anything invalid into a missing value rather than stopping the notebook.
How do I clean text columns in Python?
Use .str.strip() to remove extra spaces, .str.lower() for consistent casing, and .replace() with a dictionary to map inconsistent labels to a single standard value.
How do I standardize categories in Pandas?
Run .value_counts() to see every current label, then use .replace() with a mapping dictionary to combine inconsistent variants into one consistent category, checking .value_counts() again afterward to confirm.
How do I detect invalid values in Python?
Filter the DataFrame using logical conditions, such as df[df["age"] < 0] or df[~df["score"].between(0, 100)], to isolate rows with values outside the valid range.
How do I detect outliers in Pandas?
The interquartile range (IQR) method is a common approach: calculate the 25th and 75th percentiles, compute the IQR, and flag values that fall far below or above that range.
Should I remove outliers automatically?
No. Outliers should be reviewed individually where possible, since some represent genuine extreme cases rather than errors, and removing them automatically can distort your findings.
How do I save a cleaned dataset from Jupyter Notebook?
Use df.to_csv("cleaned_data.csv", index=False) or df.to_excel("cleaned_data.xlsx", index=False) to export your cleaned DataFrame as a new file, keeping the original raw file untouched.
Can you help fix my Pandas data cleaning code?
Yes. If your notebook is producing errors or unexpected results, you can send us your code and dataset and Request a Quote Now for debugging and correction support.
Can you clean dissertation or survey data in Jupyter Notebook?
Yes. We regularly clean dissertation, thesis, and survey datasets, including handling scale scoring, reverse-coded items, and codebook alignment, with documentation suitable for a methods section.
How much does Jupyter Notebook data cleaning help cost?
Pricing depends on factors like file size, the amount of missing or duplicate data, text and category complexity, and your deadline. Request a Quote Now with your file and requirements for an accurate estimate.
How do I Request a Quote Now?
Send your Jupyter Notebook, dataset, or assignment instructions along with your deadline and required output format, and our team will review your files and respond with a quote tailored to your project.
Order Jupyter Notebook Data Cleaning Help
Learning how to clean data in Jupyter Notebook puts you in control of your dataset, but not every project allows the time to work through missing values, duplicate IDs, inconsistent categories, and outlier reviews line by line. When you’re facing a deadline, a stubborn Pandas error, or a dataset that’s simply too messy to untangle alone, sending it to a team that handles this work daily can be the faster, safer path forward.
To get started, send us:
- Jupyter Notebook file
- Python script
- CSV file
- Excel file
- SPSS file, if the data will later be analyzed in SPSS
- Survey export
- Dissertation or thesis dataset
- Business dataset
- Assignment instructions
- Supervisor comments
- Codebook or data dictionary
- Required output format
- Deadline
Request a Quote Now for Jupyter Notebook data cleaning, Pandas code support, missing-value handling, duplicate removal, clean dataset exports, and analysis-ready reporting.