
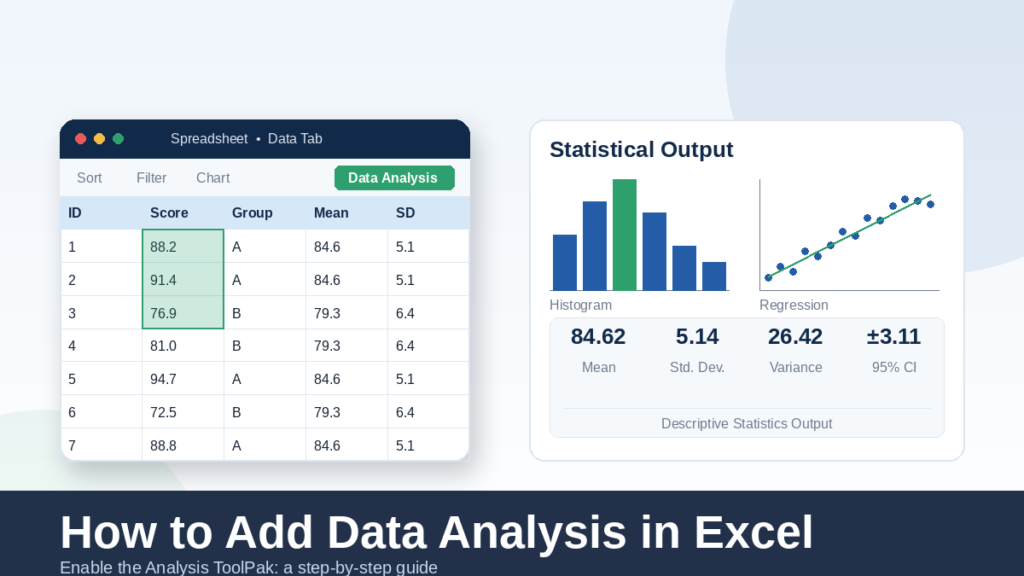
If you’ve opened Excel’s Data tab and gone looking for the Data Analysis button, only to find it isn’t there, you’re not alone. This is one of the most common frustrations for students, researchers, and analysts who need to run statistics in Excel, the tool exists, but Microsoft ships it turned off by default. It’s an add-in, not a built-in feature, so until you activate it, the button simply won’t appear no matter how many menus you click through.
In this guide, you’ll learn exactly how to enable the Analysis ToolPak on Windows and Mac, what to do when it still won’t show up, which statistical procedures it unlocks, how to run and interpret your first analysis, and where the ToolPak’s limits are, including when it’s worth bringing in professional statistical support instead of pushing Excel past what it’s built for.
Need help beyond what Excel can do? Request a data analysis quote and a statistician can take it from here.
What Is the Data Analysis ToolPak?
The Analysis ToolPak is a Microsoft Excel add-in that adds a suite of statistical and engineering analysis tools to the Data tab. Once enabled, it appears as a Data Analysis button and gives you one-click access to procedures that would otherwise require writing formulas manually, things like regression, ANOVA, t-tests, and histograms.
It was originally built for engineers and analysts who needed quick statistical calculations without leaving the spreadsheet environment, and it has shipped with Excel in some form since the early Office 97/2000 era. Today it’s available in:
- Excel 2016, 2019, 2021, and 2024 (Windows)
- Microsoft 365 (Windows and Mac)
- Excel for Mac 2019 and 2021
It is not available in Excel Online (the browser version) or in the mobile apps.
Why people use it:
- No need to memorize statistical formulas
- Fast, structured output tables
- Familiar spreadsheet environment for non-statisticians
- Good enough for coursework, basic reporting, and exploratory analysis
It’s a genuinely useful Excel data analysis tool for straightforward statistical functions, the catch is simply that it has to be switched on first.
Why the Data Analysis Button Is Missing
If your Data Analysis button is missing, it’s almost always one of these causes:
- The ToolPak was never enabled, it ships inactive by default in every Excel installation.
- You’re using the wrong Excel edition. Excel Starter and some older Home & Student editions don’t include it at all.
- You’re on Excel Online. The web version of Excel doesn’t support the Analysis ToolPak, only desktop Excel does.
- The add-in is disabled at the application level, sometimes automatically, after a crash or update.
- Your organization has restricted add-ins through IT policy (common in corporate and university-managed devices).
- Your Office installation is corrupted or incomplete, which can prevent add-ins from loading properly.
The good news: for the vast majority of users, the fix is a two-minute settings change, covered in the next two sections.
How to Add Data Analysis in Excel (Windows)
Here’s how to enable Analysis ToolPak in Excel on Windows, step by step:
- Open Excel and click File in the top-left corner.
- Select Options at the bottom of the left-hand menu.
- In the Excel Options window, click Add-ins on the left sidebar.
- At the bottom, next to Manage, make sure the dropdown says Excel Add-ins, then click Go.
- In the Add-ins dialog box, check the box next to Analysis ToolPak.
- Click OK.
Excel will install the add-in (this takes only a few seconds). Once it’s done, go to the Data tab on the ribbon, you should now see a Data Analysis button on the far right, usually in its own “Analysis” or “Analyze” group.
If you also do regression work with matrix operations, you can check Analysis ToolPak – VBA at the same time, it adds ToolPak functions you can call from macros, though most users won’t need it.
How to Enable Analysis ToolPak on Mac
The process to install Analysis ToolPak on macOS is slightly different depending on your Excel version.
Microsoft 365 for Mac and Excel 2021 for Mac:
- Open Excel and click the Tools menu at the top of the screen.
- Select Excel Add-ins.
- In the box that appears, check Analysis ToolPak.
- Click OK.
- Go to the Data tab, the Data Analysis button should now be visible.
Excel 2019 for Mac:
The steps are the same, but some users on older builds report needing to fully quit and reopen Excel (not just close the window) before the button appears on the ribbon.
A note on Mac limitations: a small number of ToolPak procedures, most notably some of the random number generation and Fourier analysis tools, have historically had quirks on Mac builds compared to Windows. For core procedures like descriptive statistics, regression, ANOVA, and t-tests, Mac and Windows behave the same way.
What If Analysis ToolPak Still Does Not Appear?
If you’ve followed the steps above and the Data Analysis button is missing anyway, work through this checklist in order:
- Restart Excel completely. Close every Excel window, not just the current file, then reopen.
- Check for a disabled add-in. Go to File → Options → Add-ins, then look in the Disabled Items dropdown at the bottom. If Analysis ToolPak is listed there, select it and click Enable.
- Run Office Repair. On Windows, go to Control Panel → Programs → Microsoft Office → Change → Quick Repair. This fixes many add-in loading issues without a full reinstall.
- Check organization policies. If you’re on a work or school-managed device, IT may have blocked add-ins entirely. Contact your IT helpdesk, this is common on locked-down corporate images.
- Check Protected View. Files opened from email attachments or downloaded from the internet sometimes open in Protected View, which can suppress ribbon add-ins until you click Enable Editing.
- Reinstall Office as a last resort if none of the above works, this clears out most corruption-related issues.
- Registry issues (Windows, advanced users only): in rare cases, a corrupted registry entry tied to Office add-ins prevents the ToolPak from loading even after reinstalling. This typically requires IT support to resolve safely, editing the registry incorrectly can cause other problems, so it’s not a step to take casually.
Statistical Analyses Available in the ToolPak
Once enabled, the ToolPak’s Data Analysis dialog gives you access to:
- Descriptive Statistics, mean, median, mode, standard deviation, and more in one summary table. Use it for a first look at any dataset.
- Histogram, visualize the distribution/frequency of a numeric variable.
- Correlation, measure the strength and direction of the linear relationship between two or more variables.
- Covariance, measure how two variables move together (less commonly used directly, but foundational to correlation and regression).
- Regression, model the relationship between a dependent variable and one or more predictors; the workhorse tool for prediction and relationship testing.
- ANOVA (Single Factor, Two-Factor With/Without Replication), compare means across three or more groups.
- t-Test (Paired, Two-Sample Equal/Unequal Variance), compare means between two groups.
- z-Test, compare means when population variance is known, typically with large samples.
- Moving Average, smooth time-series data to reveal underlying trends.
- Exponential Smoothing, a weighted forecasting method that favors recent data points.
- Sampling, pull a random or periodic sample from a larger dataset.
- Random Number Generation, generate numbers from various distributions (normal, uniform, binomial, etc.) for simulations.
- Rank and Percentile, rank values in a dataset and calculate corresponding percentiles.
When to use which: descriptive statistics for an initial data summary, correlation/regression for relationships and prediction, t-tests/ANOVA for comparing group means, and moving average/exponential smoothing for time-series trends.
Example: Running Descriptive Statistics
Here’s a full walkthrough of Excel’s most-used statistical procedure.
- Import your data. Paste or load your dataset into a worksheet, with one variable per column and a header label in row 1.
- Open the tool. Go to Data → Data Analysis → Descriptive Statistics → OK.
- Select your input range. Click the Input Range box, then select the column(s) of data you want to summarize, include the header row if you’re labeling.
- Check “Labels in First Row” if your selection includes column headers.
- Choose your output location. Select “New Worksheet Ply” to keep results separate from your raw data (recommended), or specify a cell on the current sheet.
- Check “Summary Statistics” and, optionally, “Confidence Level for Mean” if you want a confidence interval.
- Click OK.
Interpreting the output:
- Mean, the arithmetic average; sensitive to outliers.
- Median, the middle value; a better measure of center when data is skewed.
- Mode, the most frequently occurring value.
- Standard Deviation, how spread out values are around the mean.
- Variance, the standard deviation squared; used in further statistical calculations.
- Range, the difference between the maximum and minimum values.
- Minimum / Maximum, the smallest and largest values in the dataset.
- Confidence Interval, the margin of error around your mean at your chosen confidence level (e.g., 95%); useful for estimating how well your sample mean represents the true population mean.
Common Errors and How to Fix Them
- Data Analysis option missing: revisit Section 3 or 4, the add-in isn’t enabled yet.
- “Input range is invalid” error: make sure you’ve selected a contiguous range with no merged cells, and that you selected cells, not an entire column with excess blank space.
- Labels error: if you check “Labels in First Row” but your selected range doesn’t actually include a header row, Excel will misread your first data point as a label. Double-check your selection.
- Blank cells within your range: some tools (like regression) will throw errors or skew results if there are gaps in your data. Fill in, remove, or clearly flag missing values before running the analysis.
- Hidden rows or columns: the ToolPak still includes hidden cells in its calculations, which can silently distort results, unhide before running any analysis, or filter the source data properly first.
- Protected worksheet: the Data Analysis tools can’t write output to a protected sheet. Unprotect the sheet (Review → Unprotect Sheet) before running.
- Unsupported data format: text stored as numbers (or vice versa) will cause calculation errors, check cell formatting and convert as needed.
- Formula errors in source data (#N/A, #VALUE!, etc.): these will propagate into your analysis. Clean them up first, or the tool may fail outright.
Limitations of the Excel Analysis ToolPak
Excel’s ToolPak is genuinely useful, but it’s designed for quick, straightforward statistics, not for the kind of rigorous analysis academic publication or complex modeling requires. Its main limitations:
- No built-in assumption testing, no automated normality, homogeneity of variance, or multicollinearity checks. You have to test these separately.
- Limited regression diagnostics, no residual plots beyond a basic option, no VIF, no proper model comparison tools.
- No mediation or moderation analysis.
- No Structural Equation Modeling (SEM).
- No Confirmatory Factor Analysis (CFA).
- No mixed-effects or multilevel models.
- No machine learning capabilities, no classification, clustering, or predictive modeling beyond basic linear regression.
- No reproducible workflow, there’s no script or syntax log of what you ran, which makes it hard to document or repeat an analysis exactly, a real problem for research that needs to show its methodology.
For coursework, business reporting, or a first exploratory pass at data, these limitations often don’t matter. For a thesis, dissertation, or peer-reviewed publication, they usually do.
If your project needs assumption testing, regression diagnostics, or modeling beyond what the ToolPak offers, a statistical data analysis specialist can take it from here without you needing to learn a new platform from scratch.
When to move beyond Excel:
| Situation | Better Tool |
|---|---|
| Need assumption/diagnostic testing | SPSS or R |
| Mediation/moderation, SEM, CFA | R, SPSS (AMOS/PROCESS) |
| Reproducible scripted workflow | R or Python |
| Very large datasets | R, Python, or Stata |
| Publication-ready statistical reporting | SPSS, R, or Stata |
Excel vs SPSS vs R vs Python
| Criteria | Excel (ToolPak) | SPSS | R | Python |
|---|---|---|---|---|
| Ease of use | Very easy | Easy | Moderate to Hard | Moderate to Hard |
| Cost | Included with Office | Paid license | Free | Free |
| Statistical power | Basic to Intermediate | Intermediate to Advanced | Advanced | Advanced |
| Visualization | Basic charts | Good | Excellent | Excellent |
| Automation | Limited (VBA) | Moderate (syntax) | Excellent (scripts) | Excellent (scripts) |
| Good for academic research | Limited | Strong | Strong | Strong |
| Publication-ready output | Limited | Strong | Strong (with formatting packages) | Moderate to Strong |
| Learning curve | Low | Low to Moderate | Moderate to Steep | Moderate to Steep |
Takeaway: Excel is the easiest entry point and fine for basic statistics; SPSS is the standard in many social science and health research programs; R and Python offer the most power and flexibility but demand more time to learn.
Best Practices for Excel Data Analysis
- Clean your data first. Remove duplicates, standardize formatting, and handle blanks before running any tool.
- Check assumptions manually where the ToolPak doesn’t do it for you (e.g., normality before a t-test).
- Save backups of your raw data before transforming or analyzing it, so you can always start over.
- Validate outputs by spot-checking a calculation manually or against another method.
- Avoid manual calculations where a built-in function or the ToolPak already exists, manual formulas are a common source of error.
- Document every analysis, note exactly what settings and ranges you used, since Excel won’t log this for you automatically.
- Verify missing values are handled deliberately (excluded, imputed, or flagged) rather than left to distort your results silently.
When Professional Help Makes Sense
Excel’s Analysis ToolPak covers a lot of ground, but there are situations where it’s worth bringing in outside statistical expertise rather than trying to stretch the tool past its design:
- Dissertation or thesis deadlines, where committee-level rigor is expected and there’s little room for error.
- Complex statistical models, mediation, moderation, multilevel/mixed models, SEM, or advanced regression diagnostics.
- Publication-quality reporting, where journals expect specific formats, assumption checks, and effect sizes the ToolPak doesn’t generate.
- Large or messy datasets that need substantial cleaning, merging, or restructuring before analysis is even possible.
- Survey data analysis, especially with Likert-scale items, weighting, or complex skip logic.
- Advanced hypothesis testing beyond simple t-tests and ANOVA.
If any of that sounds like your project, it’s reasonable to get a second set of eyes from someone who works in statistics full-time.
Request a quote to talk through your project, there’s no obligation, and it’s a fast way to find out whether Excel is enough or whether you need something more.
Frequently Asked Questions
How do I add Data Analysis in Excel?
Go to File → Options → Add-ins, set the Manage dropdown to Excel Add-ins, click Go, check the box for Analysis ToolPak, and click OK. The Data Analysis button will then appear on the Data tab. On Mac, it’s under Tools → Excel Add-ins instead.
Why can’t I see the Data Analysis button?
Almost always because the Analysis ToolPak add-in hasn’t been enabled yet, it’s off by default in every fresh Excel install. Other possible causes include using Excel Online (which doesn’t support it), a restricted work/school device, or a corrupted Office installation.
Is Analysis ToolPak free?
Yes. It’s included with every desktop version of Excel that supports it (Windows and Mac, Office 2016 and later, and Microsoft 365) at no additional cost, you just need to turn it on.
Does Excel Online support Analysis ToolPak?
No. The Analysis ToolPak only works in the desktop versions of Excel for Windows and Mac. The browser-based Excel Online does not support it, and there’s currently no workaround for that.
How do I run regression in Excel?
Enable the Analysis ToolPak, then go to Data → Data Analysis → Regression. Set your Y (dependent variable) range and X (independent variable) range, choose an output location, and click OK. Excel will generate a regression summary including coefficients, R-squared, and significance values.
Can Excel perform ANOVA?
Yes. The ToolPak includes Single Factor ANOVA and Two-Factor ANOVA (with and without replication) under Data → Data Analysis. These let you compare means across three or more groups.
How do I create a histogram in Excel?
You can use the ToolPak’s Histogram tool (Data → Data Analysis → Histogram) for a classic bin-based frequency table and chart, or use Excel’s built-in Histogram chart type directly from Insert → Charts without enabling the ToolPak at all.
Is Excel good enough for dissertation statistics?
It depends on the complexity of your analysis. For descriptive statistics, correlations, basic regression, or simple group comparisons, Excel is often sufficient. For advanced modeling, assumption testing, or publication-standard reporting, most dissertation committees expect SPSS, R, or similar dedicated statistical software.
What is the difference between Analysis ToolPak and Power Query?
They serve different purposes. Power Query is for importing, cleaning, and reshaping data (ETL). The Analysis ToolPak is for running statistical calculations on data that’s already clean and structured. Many workflows use both, Power Query first, then the ToolPak.
Can I use Analysis ToolPak on Mac?
Yes, on Microsoft 365 for Mac, Excel 2021 for Mac, and Excel 2019 for Mac. Enable it through Tools → Excel Add-ins rather than the Windows-style File → Options path.
Why is the ToolPak disabled?
Microsoft ships it as an inactive add-in by default across all Excel installations, likely because most everyday spreadsheet users don’t need statistical analysis tools and Microsoft keeps the base ribbon uncluttered. It has to be manually enabled once per installation.
When should I use SPSS instead of Excel?
When you need assumption testing, advanced regression diagnostics, mediation/moderation analysis, SEM, mixed models, or output formatted to academic publication standards. SPSS is also often the required or expected tool in social science, health, and education research programs specifically.
Can Excel handle large datasets?
Excel can technically handle over a million rows, but performance degrades noticeably with heavy statistical calculations on large datasets, and the ToolPak wasn’t optimized for big-data workloads. For very large or complex datasets, R, Python, or a dedicated statistics package will usually perform better.
Is Analysis ToolPak available in Microsoft 365?
Yes, it’s available in Microsoft 365 for both Windows and Mac. It’s enabled the same way as in perpetual-license versions of Excel, through Add-ins settings, and isn’t tied to any particular 365 subscription tier.