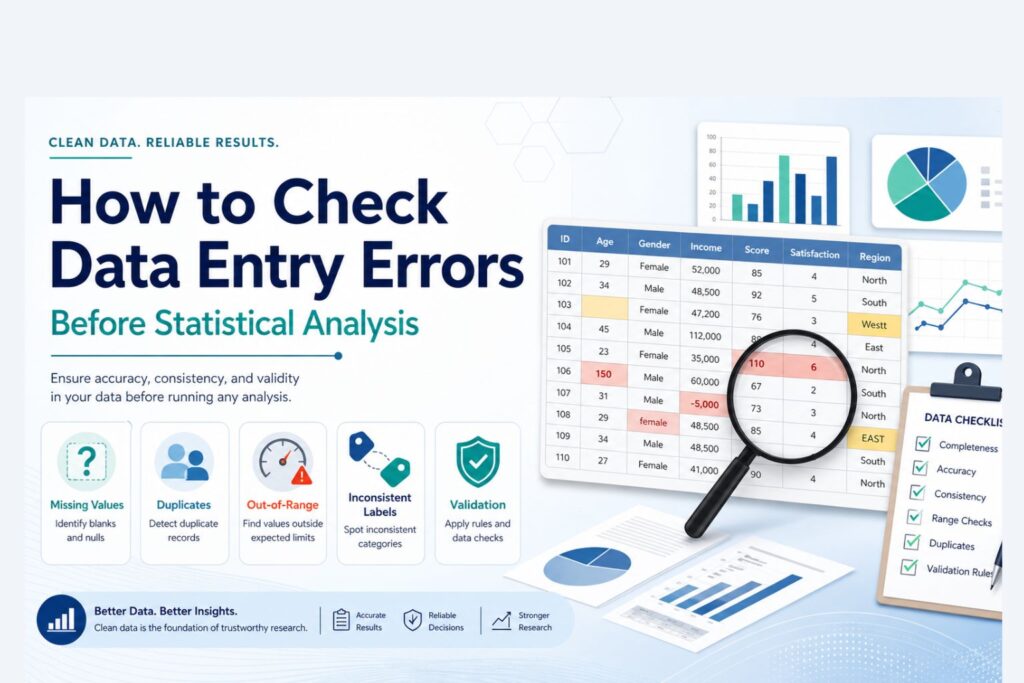
How to Check Data Entry Errors Before Statistical Analysis
Data entry errors can weaken a research project before the main analysis begins. A dataset may look complete, but hidden mistakes such as invalid codes, duplicate records, wrong labels, impossible values, missing value errors, reversed scale items, and misplaced decimals can change the final results.
Statistical software can still produce output from incorrect data. SPSS, Excel, R, Stata, and Python do not automatically know whether a value is realistic, whether a category was coded correctly, or whether a respondent appears twice. This is why checking data entry errors is an important step before descriptive statistics, hypothesis testing, regression, ordinal regression, logistic regression, reliability analysis, and dissertation reporting.
Checking data entry errors means reviewing the dataset for values that are wrong, inconsistent, incomplete, duplicated, incorrectly coded, or entered in the wrong format. A clean dataset gives the analysis a stronger foundation and makes the final results easier to interpret and defend.
Need help checking your dataset before analysis? Request Quote Now
What Are Data Entry Errors?
Data entry errors are mistakes that occur when data is typed, imported, coded, copied, merged, transferred, or prepared for analysis. These errors can happen in manually entered spreadsheets, online survey exports, SPSS files, secondary datasets, clinical records, business databases, or dissertation datasets.
A data entry error is not always a blank cell. Sometimes the value exists, but the value is wrong. For example, age may be entered as 225 instead of 25. A Likert scale response may be entered as 7 when the valid range is 1 to 5. A gender variable may contain “Male,” “male,” “M,” and “1,” even though all four entries may refer to the same group.
| Error Type | Example | Possible Effect |
|---|---|---|
| Typing error | Age entered as 225 instead of 25 | Distorts means, ranges, and outlier checks |
| Wrong category code | Gender coded as 5 when only 1 and 2 are valid | Creates invalid frequency results |
| Missing value error | 99 used for missing but treated as a real value | Inflates averages and model estimates |
| Duplicate record | Same respondent entered twice | Overrepresents one case |
| Decimal error | 45.0 entered instead of 4.5 | Creates an extreme outlier |
| Reverse-code error | Negative Likert item not reversed | Weakens reliability and changes scale meaning |
| Format error | Numeric variable stored as text | Prevents analysis or causes import issues |
| Label inconsistency | “Female,” “female,” and “F” all used | Splits one category into several categories |
Data entry errors are common because research data often moves through multiple stages. A survey may begin in Google Forms, move into Excel, and then be imported into SPSS. A secondary dataset may be downloaded, filtered, merged, recoded, and analyzed. Each stage creates opportunities for errors to enter the file.
For broader support with research data, visit Data Analysis Help.
Why Checking Data Entry Errors Matters
Data entry errors affect the accuracy of statistical analysis. Even a small number of errors can change descriptive statistics, reliability results, correlations, regression coefficients, group comparisons, p-values, confidence intervals, and final conclusions.
A single wrong value may not matter much in a very large dataset, but it can have a major effect in a small dissertation sample. A missing value code such as 99 can inflate an average if SPSS treats it as a real number. A duplicate response can strengthen a relationship that is not actually strong. A reversed Likert item can reduce Cronbach’s alpha and make a valid scale appear unreliable.
| Analysis Area | How Data Entry Errors Can Affect Results |
|---|---|
| Descriptive statistics | Wrong means, ranges, percentages, and standard deviations |
| Reliability analysis | Low or misleading Cronbach’s alpha |
| Correlation | False strength or direction of relationships |
| Regression | Biased coefficients and unstable predictions |
| T tests | Incorrect group comparisons |
| ANOVA | Wrong group means and significance values |
| Chi-square tests | Incorrect category counts |
| Ordinal regression | Misordered outcome categories and misleading estimates |
| Logistic regression | Wrong event category or unstable coefficients |
| Dissertation reporting | Weak or misleading results chapter |
Data quality matters because the final analysis is only as reliable as the dataset used to produce it. Statistical output may look clean and professional even when the underlying data contains errors.
For dissertation-focused analysis support, visit Dissertation Data Analysis Help.
Data Entry Errors vs Data Cleaning vs Data Validation
Although data entry error checking, data cleaning, and data validation are connected, each one plays a different role in preparing a dataset for analysis.
| Term | Meaning | Example |
|---|---|---|
| Data entry error checking | Finding mistakes introduced during entry, import, coding, or transfer | Finding age entered as 250 instead of 25 |
| Data cleaning | Correcting, recoding, formatting, and preparing data for analysis | Defining missing values and standardizing category labels |
| Data validation | Checking whether values follow expected rules or logic | Confirming that satisfaction scores fall between 1 and 5 |
Data entry error checking is usually the first step because the dataset must be reviewed before any correction is made. Once the errors are identified, cleaning involves correcting, recoding, formatting, or preparing the file for analysis. Validation adds another layer of protection by setting rules for acceptable values, formats, ranges, and categories.
For example, if a survey allows satisfaction scores from 1 to 5, data validation can prevent a value of 8 from being entered. If the error has already entered the dataset, data entry checking helps find it, and data cleaning helps correct or manage it.
Common Types of Data Entry Errors
Different datasets have different error patterns. Survey data often contains missing values and inconsistent response labels. Clinical data may contain date errors and unit problems. Dissertation datasets often contain reverse-coded item errors, invalid Likert values, and missing value mistakes.
Missing Value Errors
Missing value errors occur when unanswered items, skipped questions, or unavailable records are not handled consistently. They may appear as blank cells, dots, “NA,” “N/A,” “missing,” “prefer not to say,” 99, 999, or another placeholder.
The main issue is whether the software treats the missing code as missing or as a real value.
| Missing Value Pattern | Problem |
|---|---|
| Blank cells mixed with 99 | Missing data is not coded consistently |
| 999 treated as a real score | Mean and standard deviation become inflated |
| “N/A” entered in numeric variable | Variable may become text |
| Prefer not to say mixed with missing | Response category may be confused with nonresponse |
| Different missing codes across variables | Analysis becomes harder to interpret |
Out-of-Range Values
Out-of-range values appear when an entry falls outside the limits expected for that variable. These errors are common in survey data, SPSS files, Excel sheets, and manually entered research datasets.
| Variable | Expected Range | Suspicious Value |
|---|---|---|
| Age | 18 to 65 | 180 |
| Likert scale | 1 to 5 | 7 |
| Percentage | 0 to 100 | 145 |
| Exam score | 0 to 100 | 120 |
| Satisfaction level | 1 to 5 | 0 |
| Work experience | 0 to 50 years | 99 |
Values outside the expected range may come from typing mistakes, wrong coding, misplaced decimals, incorrect missing value codes, or imported data problems. Frequency tables, descriptive statistics, filters, sorting, and validation checks can help identify these errors before analysis.
Inconsistent Category Labels
Category labels are often inconsistent when data is entered manually or exported from different sources.
| Same Intended Category | Inconsistent Entries |
|---|---|
| Male | Male, male, M, 1 |
| Female | Female, female, F, 2 |
| Yes | Yes, yes, Y, 1 |
| No | No, no, N, 0 |
| Full time | Full-time, full time, FT |
Inconsistent labels can create extra categories and distort frequency tables, group comparisons, chi-square tests, and regression models.
Duplicate Records
Duplicate records occur when the same case appears more than once.
| Duplicate Type | Example |
|---|---|
| Exact duplicate | Same respondent appears twice with identical answers |
| Partial duplicate | Same email appears with slightly different answers |
| Survey duplicate | Respondent submits the form more than once |
| Merge duplicate | Same participant appears twice after combining files |
| Import duplicate | Same dataset imported twice |
Duplicates can inflate sample size and overrepresent certain cases.
Decimal and Unit Errors
Decimal and unit errors can create unrealistic values.
| Error | Example | Possible Cause |
|---|---|---|
| Decimal misplaced | 45 instead of 4.5 | Typing mistake |
| Extra zero | 50000 instead of 5000 | Manual entry error |
| Unit mismatch | Pounds and kilograms mixed | Inconsistent measurement units |
| Currency mismatch | Monthly income mixed with annual income | Wrong reporting unit |
| Percentage error | 0.85 entered as 85 or 85 entered as 0.85 | Format confusion |
These errors are especially important in healthcare, finance, business, and scientific datasets.
Reverse-Coding Errors
Reverse-coding errors are common in questionnaire and Likert scale data. A negatively worded item must be reversed before creating a scale score.
For example, if most items measure satisfaction positively, a negative item such as “I am unhappy with the service” must be coded in the opposite direction before combining it with the other satisfaction items.
| Problem | Effect |
|---|---|
| Negative item not reversed | Scale score becomes misleading |
| Wrong item reversed | Valid item becomes incorrect |
| Reverse coding applied twice | Item returns to wrong direction |
| Composite score created too early | Incorrect scale used in later analysis |
Reverse-code errors can affect reliability, factor analysis, correlation, regression, and interpretation.
Wrong Variable Type
A variable may be stored in the wrong format. For example, age may be stored as text, a date may be imported as a string, or a categorical variable may be treated as scale.
| Variable Setup Error | Possible Effect |
|---|---|
| Numeric variable stored as string | Analysis may not run |
| Date stored as text | Time calculations become difficult |
| Category treated as scale | Wrong descriptive statistics may be used |
| Scale variable treated as nominal | Output may be limited |
| Value labels missing | Categories become hard to interpret |
For SPSS support, visit SPSS Analysis Help.
Data Entry Error Audit Framework
A strong dataset review follows a structured process. The audit framework below can be used for dissertation data, survey data, SPSS files, Excel files, secondary datasets, and business reports.
| Audit Stage | Main Question | What to Check |
|---|---|---|
| Structure audit | Is the dataset arranged correctly? | Rows, columns, variable names, labels |
| Range audit | Are values within valid limits? | Minimum, maximum, expected scale range |
| Category audit | Are categorical values valid? | Frequencies, labels, invalid codes |
| Missing value audit | Are missing values handled correctly? | Blanks, 99, 999, N/A, user-missing values |
| Duplicate audit | Are cases repeated? | IDs, emails, timestamps, repeated rows |
| Logic audit | Do related variables make sense together? | Age and education, dates, group membership |
| Outlier audit | Are extreme values valid or errors? | Boxplots, standardized values, source checks |
| Scale audit | Are Likert and composite variables correct? | Reverse coding, item ranges, reliability |
| Format audit | Are variable types correct? | Numeric, string, date, nominal, ordinal, scale |
| Analysis-readiness audit | Is the file ready for statistical testing? | Clean copy, documented changes, final checks |
This framework is useful because it separates different types of errors rather than treating “data cleaning” as one broad task. A dataset may pass one stage and fail another. For example, the ranges may be correct, but duplicate records may still exist. Category labels may be clean, but reverse-coded items may still be wrong.
Data Entry Error Checklist
The checklist below can be used before running any statistical analysis.
| Area to Check | What to Look For |
|---|---|
| Variable names | Short, clear, consistent names |
| Variable labels | Clear descriptions of each variable |
| Value labels | Correct labels for coded categories |
| Missing values | Blanks, 99, 999, NA, prefer not to say |
| Valid ranges | Values within expected limits |
| Categories | No extra, misspelled, or inconsistent categories |
| Duplicates | Repeated IDs, rows, timestamps, or submissions |
| Outliers | Extreme values that may be errors |
| Reverse-coded items | Negative items coded correctly |
| Measurement levels | Nominal, ordinal, and scale assigned correctly |
| Composite scores | Created after item checks |
| Imported data | No shifted columns or broken formats |
| Dates | Valid order and format |
| Units | Same measurement unit across records |
| Final file | Cleaned copy saved separately from raw data |
The raw dataset should remain unchanged. A cleaned version should be saved separately so that changes are traceable.
How to Check Data Entry Errors in SPSS
SPSS has several tools for detecting data entry errors. The best option depends on the type of variable being checked.
Frequencies
Frequencies are useful for categorical, ordinal, and Likert scale variables. They show all values that appear in a variable.
Useful for checking:
- Invalid category codes
- Missing value patterns
- Unexpected response options
- Likert scale ranges
- Small or empty categories
SPSS path:
Analyze > Descriptive Statistics > Frequencies
Descriptives
Descriptives are useful for continuous variables. They show minimum, maximum, mean, and standard deviation.
Useful for checking:
- Impossible values
- Extreme values
- Incorrect ranges
- Decimal errors
- Unusual distributions
SPSS path:
Analyze > Descriptive Statistics > Descriptives
Explore
Explore is useful for reviewing outliers, distributions, and plots.
Useful for checking:
- Boxplots
- Extreme cases
- Distribution shape
- Normality patterns
- Group-based summaries
SPSS path:
Analyze > Descriptive Statistics > Explore
Identify Duplicate Cases
SPSS can identify duplicate cases based on selected variables such as participant ID, email address, record number, or timestamp.
Useful for checking:
- Double submissions
- Repeated records
- Imported duplicates
- Duplicate participant IDs
- Duplicate rows after merging files
SPSS path:
Data > Identify Duplicate Cases
Sort Cases
Sorting values can reveal impossible entries quickly. Sorting age from highest to lowest, for example, may show values such as 180 or 999.
Useful for checking:
- Extreme high values
- Extreme low values
- Negative values where none should exist
- Date problems
- Category codes outside the expected range
SPSS path:
Data > Sort Cases
Variable View Review
Variable View is essential for checking SPSS setup errors.
| Variable View Area | What to Review |
|---|---|
| Name | Clear and consistent variable names |
| Type | Numeric, string, or date format |
| Label | Clear explanation of the variable |
| Values | Correct category labels |
| Missing | Properly defined missing codes |
| Measure | Nominal, ordinal, or scale |
| Decimals | Appropriate decimal places |
A variable can contain correct numbers but still be set up incorrectly in SPSS. For example, a satisfaction scale may have valid values but missing labels or the wrong measurement level.
For more SPSS data preparation support, visit How to Clean Data in SPSS.
SPSS Error Checks by Variable Type
Different variable types require different checks.
| Variable Type | Examples | Best Checks |
|---|---|---|
| Nominal | Gender, group, treatment type | Frequencies, value labels, invalid codes |
| Ordinal | Satisfaction level, education level, pain severity | Frequencies, order of categories, missing values |
| Scale | Age, income, test score | Descriptives, minimum, maximum, outliers |
| Date | Start date, completion date | Format, impossible dates, date order |
| ID variable | Participant ID, case number | Duplicates, blanks, inconsistent formats |
| Likert item | 1 to 5 agreement item | Frequencies, range checks, reverse coding |
| Composite scale | Mean satisfaction score | Item checks, reliability, valid score range |
This matters because not all errors are detected the same way. A frequency table is powerful for categorical variables, while minimum and maximum checks are better for continuous variables.
How to Check Data Entry Errors in Excel
Many datasets begin in Excel before they are imported into SPSS or another statistical program. Excel is useful for early error detection because sorting, filters, and conditional formatting make unusual entries easier to see.
| Excel Tool | Use |
|---|---|
| Filters | Find blanks, invalid categories, unusual values |
| Sort | Reveal extreme high or low values |
| Conditional formatting | Highlight values outside expected ranges |
| Remove duplicates | Identify repeated rows |
| Data validation | Prevent invalid future entries |
| TRIM function | Remove hidden spaces |
| COUNTIF | Count repeated values |
| Pivot tables | Summarize categories and detect inconsistencies |
| Find and Replace | Standardize category labels |
| Text to Columns | Fix imported format problems |
Excel errors often happen because columns can contain mixed formats. A numeric column may include text, symbols, hidden spaces, or inconsistent units. These problems may not be obvious until the file is imported into SPSS.
Before importing Excel data into SPSS, variable names, category labels, missing value codes, numeric formats, and blank cells should be reviewed carefully.
Data Entry Errors in Survey Data
Survey datasets often contain specific data entry and export problems. These problems may come from skipped questions, optional responses, multiple submissions, branching logic, or export settings.
| Survey Issue | Example | Effect |
|---|---|---|
| Incomplete response | Respondent answered only half the survey | Missing data and reduced sample size |
| Duplicate submission | Same respondent submitted twice | Inflated sample pattern |
| Skipped required item | Important variable missing | Weakens analysis |
| Branching logic issue | Respondent skipped a section incorrectly | Missing values not random |
| Multiple response export | One question split across several columns | Requires careful recoding |
| Text response in numeric item | “five” typed instead of 5 | Format problem |
| Straight-lining | Same response for every Likert item | Possible low-quality response |
Survey data should be reviewed before creating scale scores, running reliability analysis, or testing hypotheses.
Data Entry Errors in Likert Scale Data
Likert scale data is especially vulnerable to data entry problems because many variables use the same response range. A survey may contain dozens of 1 to 5 items, making one wrong value difficult to notice.
Common Likert scale errors include:
- Values outside the scale range
- Missing response codes treated as real values
- Reverse-coded items not corrected
- Mixed response anchors across items
- Text responses mixed with numeric codes
- Composite scores created before cleaning
- Items combined when they measure different constructs
| Likert Issue | Example | Possible Effect |
|---|---|---|
| Out-of-range value | 6 on a 1 to 5 scale | Invalid frequency and mean |
| Reverse-code error | Negative item not reversed | Low reliability |
| Mixed anchors | 1 = Agree in one item, 1 = Disagree in another | Opposite interpretation |
| Missing code error | 99 treated as valid | Inflated mean |
| Wrong composite score | Items averaged before cleaning | Misleading scale score |
Likert data should be checked before reliability analysis, factor analysis, correlation, regression, ordinal regression, or group comparisons.
For survey and SPSS support, visit SPSS Data Analysis Help.
Data Entry Errors and Ordinal Regression
Ordinal regression is sensitive to coding errors because the dependent variable must have ordered categories. If the outcome categories are entered incorrectly, the model can produce misleading results.
For example, satisfaction may be coded as:
1 = Low
2 = Medium
3 = High
If some records use:
0 = Low
1 = Medium
2 = High
or if “High” is accidentally coded lower than “Medium,” the outcome order becomes distorted.
| Ordinal Variable Problem | Effect on Ordinal Regression |
|---|---|
| Wrong category order | Misleading interpretation |
| Invalid category code | Incorrect outcome distribution |
| Mixed coding systems | Distorted model estimates |
| Missing values treated as valid codes | Inflated or biased results |
| Sparse categories | Unstable estimates |
| Reversed outcome coding | Opposite interpretation |
Ordinal outcomes such as satisfaction level, agreement level, pain severity, education level, and risk category should be checked carefully before analysis.
For related support with model selection and regression, visit Regression Analysis Help.
Data Entry Errors Before Regression Analysis
Regression analysis depends heavily on clean variables. Errors in the dependent variable, predictors, missing values, outliers, or categorical coding can affect the model.
| Data Entry Problem | Effect on Regression |
|---|---|
| Wrong dependent variable value | Biased model estimates |
| Predictor coded incorrectly | Wrong coefficient direction |
| Missing value code treated as real | Distorted model results |
| Duplicate cases | Inflated sample pattern |
| Extreme outlier | Unstable coefficients |
| Categorical predictor not coded properly | Incorrect group comparison |
| Reverse-coded scale error | Weak or reversed relationship |
Before regression, the dependent variable should be checked for valid values, predictors should be correctly coded, and outliers should be reviewed. For multiple regression, relationships among predictors should also be reviewed because highly related predictors may create multicollinearity.
Data Entry Errors Before Descriptive Statistics
Descriptive statistics are often the first results shown in a dissertation or research report. If the data contains entry errors, the descriptive summary may become misleading.
Examples:
- Mean age may be wrong because age 25 was entered as 250
- Gender percentages may be wrong because “F” and “Female” were treated as separate categories
- Average satisfaction may be wrong because 99 was treated as a valid score
- Range may appear too wide because of one misplaced decimal
- Sample size may be inflated because duplicate responses were not removed
Descriptive statistics are useful not only for reporting results but also for detecting early data problems.
Data Entry Errors Before Hypothesis Testing
Hypothesis testing becomes unreliable when data entry errors remain in the dataset. The test may still produce a p-value, but the result may not reflect the true pattern in the data.
| Test Type | Data Entry Issues to Check |
|---|---|
| T test | Group coding, outcome values, missing data |
| ANOVA | Group labels, category counts, outliers |
| Chi-square | Category coding, expected counts, invalid values |
| Correlation | Outliers, scale variables, missing values |
| Regression | Outcome coding, predictors, duplicates, outliers |
| Ordinal regression | Ordered category coding, sparse categories |
| Logistic regression | Binary outcome coding, event category, missing values |
| Reliability analysis | Reverse-coded items, item ranges, missing responses |
A reliable hypothesis test depends on a clean dataset, correctly coded variables, and an analysis method that fits the research question.
For testing support, visit Hypothesis Testing Help.
How to Correct Data Entry Errors
Correcting data entry errors requires judgment. Not every unusual value is wrong, and not every missing value should be deleted.
| Error Type | Possible Correction |
|---|---|
| Typing error | Correct if source document confirms the true value |
| Invalid category | Recode if the correct category is known |
| Missing value code | Define as missing or recode properly |
| Duplicate case | Remove or retain based on study design |
| Outlier | Verify, correct, retain, or document |
| Reverse-code error | Recode item before scale creation |
| Wrong variable type | Convert string to numeric or correct format |
| Inconsistent labels | Standardize category names |
| Decimal error | Correct only when true value is clear |
The raw file should remain unchanged. Corrections should be made in a copied working file, with enough notes to explain what changed and why.
Data Entry Error Log
An error log records what was found and what was changed. This is useful for dissertation work, research audits, collaborative projects, and professional reports.
| Item | Example |
|---|---|
| Variable | age |
| Case ID | 104 |
| Error found | Age entered as 250 |
| Source checked | Original questionnaire |
| Correction made | Changed to 25 |
| Reason | Typing error confirmed |
| Date corrected | 12 May 2026 |
| Corrected by | Analyst initials |
An error log helps protect transparency. It also makes the cleaning process easier to explain if a supervisor, examiner, reviewer, or client asks how the dataset was prepared.
Common Mistakes When Checking Data Entry Errors
Deleting Values Too Quickly
Some unusual values are valid. Removing them without checking the source can damage the dataset.
Treating Missing Codes as Real Values
Codes such as 99, 999, or 0 may represent missing data. If they are not defined properly, they may distort means, correlations, and regression models.
Checking Only the Dependent Variable
Predictors, grouping variables, demographic variables, and scale items can also contain errors.
Ignoring Duplicate Records
Duplicate records can inflate sample size and overrepresent certain respondents.
Forgetting Reverse-Coded Items
Reverse-coded items can weaken reliability and change the meaning of composite scores.
Using SPSS Output Without Checking Variable Setup
SPSS output is only meaningful when variables are coded and labeled correctly.
Mixing Cleaning and Analysis in the Same File
The raw file should remain untouched. A separate cleaned version should be used for analysis.
How Statistical Analysis Help Supports Data Error Checking
At Statistical Analysis Help, students, researchers, and professionals can get support with checking, cleaning, preparing, and reviewing datasets before analysis.
Support may include:
- Data entry error checking
- Missing value review
- Duplicate case detection
- Outlier screening
- Variable coding review
- Value label correction
- SPSS file preparation
- Excel to SPSS data review
- Likert scale coding checks
- Reverse-coded item correction
- Composite score preparation
- Data cleaning report support
- Regression-ready dataset preparation
- Dissertation results preparation
A dataset with hidden errors can weaken the entire analysis. A cleaned and well-structured file makes the results easier to trust, interpret, and report.
Need expert help checking your dataset? Request Quote Now
Final Thoughts
Data entry errors are easy to miss, but they can have a serious effect on statistical results. A single invalid code, duplicate case, misplaced decimal, reversed Likert item, or missing value mistake can change the meaning of the analysis.
Checking data entry errors improves the accuracy of descriptive statistics, hypothesis testing, regression, ordinal regression, survey analysis, and dissertation reporting. A clean dataset gives the analysis a stronger foundation and makes interpretation easier to defend.
The strongest statistical results begin before the main test is run. They begin with a dataset that has been checked, cleaned, labeled, coded, and prepared correctly.
Need your dataset checked before analysis? Request Quote Now
FAQ
What are data entry errors?
Data entry errors are mistakes that occur when information is typed, imported, coded, copied, merged, or transferred into a dataset. Examples include wrong codes, missing values, duplicate records, impossible values, inconsistent labels, and decimal errors.
How do data entry errors affect statistical analysis?
Data entry errors can distort means, percentages, standard deviations, correlations, regression coefficients, reliability results, p-values, and final interpretation. Even small errors can create misleading findings.
How can data entry errors be checked in SPSS?
Data entry errors can be checked in SPSS using Frequencies, Descriptives, Explore, Sort Cases, Identify Duplicate Cases, Variable View, value labels, missing value settings, and outlier checks.
How can data entry errors be checked in Excel?
Excel can help identify data entry errors using filters, sorting, conditional formatting, remove duplicates, data validation, COUNTIF, pivot tables, Find and Replace, and formatting checks.
What is the easiest way to find invalid category codes?
Frequency tables are often the easiest way to find invalid category codes. They show every value that appears in a variable, making unexpected codes easier to spot.
Should outliers always be removed?
No. Outliers should be reviewed carefully. Some outliers are valid observations, while others are data entry errors. Removal should depend on evidence and research context.
Why are duplicate records a problem?
Duplicate records can inflate sample size and overrepresent certain cases. This can affect percentages, means, correlations, regression results, and hypothesis testing.
What is a missing value coding error?
A missing value coding error occurs when a missing value code such as 99 or 999 is treated as a real value. This can distort descriptive statistics and inferential tests.
How do data entry errors affect ordinal regression?
Ordinal regression depends on correctly ordered outcome categories. Wrong category order, invalid codes, sparse categories, and missing codes treated as real values can distort the model.
How do data entry errors affect Likert scale analysis?
Likert scale errors can affect means, reliability, factor analysis, regression, and interpretation. Common issues include reverse-code errors, out-of-range values, missing value mistakes, and mixed response anchors.
What is the difference between data entry error checking and data cleaning?
Data entry error checking focuses on finding mistakes in the dataset. Data cleaning focuses on correcting, recoding, formatting, and preparing the data for analysis.
Why should the raw dataset be saved separately?
The raw dataset should be preserved so original values remain available. A separate cleaned file creates a clear audit trail and protects the integrity of the data preparation process.
Can Statistical Analysis Help check my dataset for errors?
Yes. Statistical Analysis Help can review SPSS, Excel, survey, and research datasets for missing values, invalid codes, duplicates, outliers, variable setup problems, and other data entry errors. Start here: Request Quote Now.