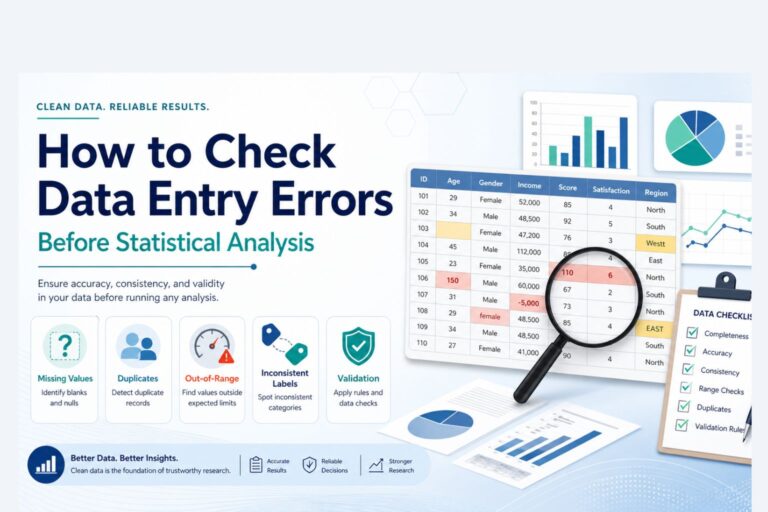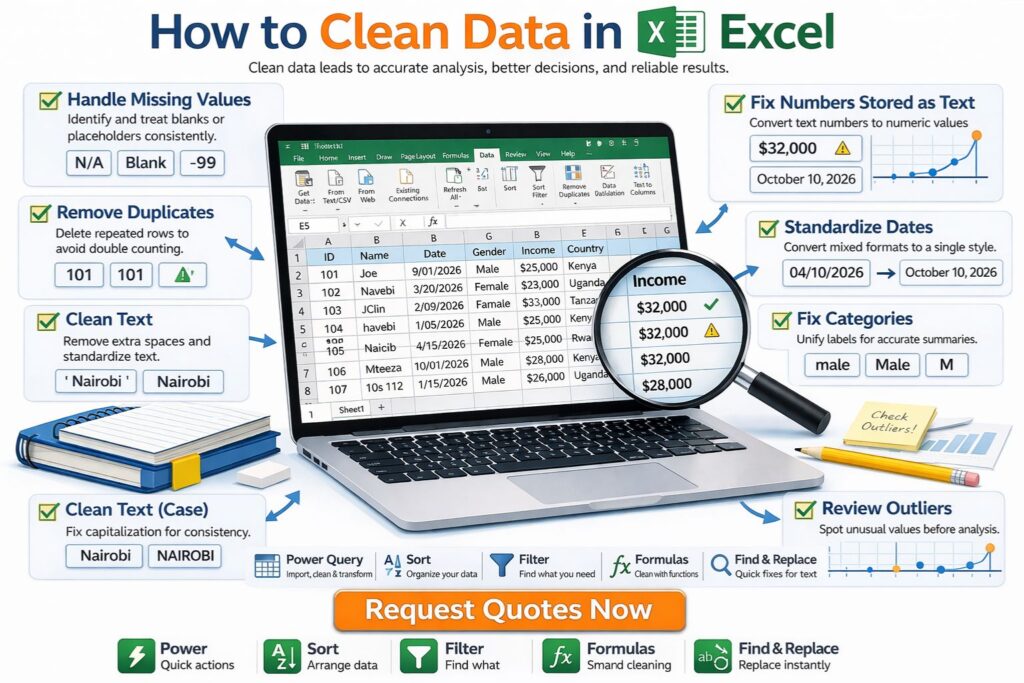
How to Clean Data in Excel
A dataset can look tidy on the screen and still create serious problems during analysis. A date column may contain mixed formats, names may include extra spaces, duplicate records may inflate totals, and numeric values may be stored as text without being noticed. These issues are common in research datasets, business reports, exported system files, survey results, and administrative records. They often go unnoticed until the summaries look wrong or the analysis refuses to behave properly.
That is why learning how to clean data in Excel matters. Clean data make calculations more accurate, tables easier to trust, and later analysis much more stable. Once the structure is consistent, missing values are reviewed properly, duplicates are removed, and the columns use the correct formats, the rest of the work becomes easier to manage.
Excel remains one of the most widely used tools for data cleaning because it is accessible, familiar, and flexible. It allows quick inspection of messy records and provides practical tools for sorting, filtering, standardizing, splitting, merging, and validating data. This stage often sits at the center of broader data analysis help, research statistics help, and full statistical analysis help.
If your spreadsheet still looks inconsistent and the analysis cannot move forward confidently, Request Quotes Now.
What Data Cleaning in Excel Includes
Data cleaning in Excel usually involves reviewing the dataset for missing values, duplicate records, inconsistent text, wrong formats, invalid entries, messy dates, and structural issues such as merged cells or poor column naming. The aim is to make the spreadsheet accurate, consistent, and ready for analysis or reporting.
In practical work, this often means trimming spaces from text, standardizing category labels, converting numbers stored as text, cleaning date columns, checking for impossible values, and removing repeated rows. In some projects, it also involves separating combined values into distinct columns or combining split information into one usable field.
The goal is not to force the data into an artificial pattern. The goal is to make the spreadsheet reflect the real information in a consistent way.
Why Data Cleaning Matters Before Analysis
Dirty data distort results quietly. A category may be counted three times under slightly different names. A date filter may fail because some entries are true Excel dates and others are text strings. A summary statistic may be wrong because one outlier was caused by an entry error. A total may be overstated because duplicate rows were left in the file.
These are not minor spreadsheet issues. They affect conclusions.
That is why cleaning belongs before dashboards, pivot tables, descriptive summaries, regression, hypothesis testing, or formal reporting. Work that later moves into inferential statistics help or broader research statistics help becomes more dependable when the dataset has already been prepared properly.
Common Data Problems in Excel
Most messy Excel datasets repeat the same kinds of problems.
| Problem | What it looks like |
|---|---|
| Missing values | Blank cells, placeholder text, inconsistent labels |
| Duplicate rows | Repeated records or IDs |
| Extra spaces | Nairobi, Kenya , double spaces in names |
| Inconsistent categories | Male, male, M, m |
| Numbers stored as text | Left-aligned numbers, warning icons |
| Mixed date formats | 10/04/2026, 2026-04-10, April 10 2026 |
| Invalid values | Impossible ages, negative quantities, wrong scales |
| Merged cells or blank rows | Broken table structure |
| Messy column headings | Long labels, spaces, unclear names |
Once these issues are corrected, the spreadsheet becomes much easier to summarize, filter, visualize, and analyze.
A Strong Excel Data Cleaning Workflow
A practical cleaning workflow in Excel usually begins with inspection. Before changing anything, it helps to review the column names, scan the first rows, sort selected columns, apply filters, and identify obvious inconsistencies.
A clean starting sequence often looks like this:
- review the headers
- remove blank rows
- check for duplicates
- standardize text entries
- confirm number and date formats
- inspect missing values
- review unusual or impossible values
- save a cleaned version of the file
That order helps because it reveals the structure of the dataset before any major edits are made. It also reduces the chance of cleaning one problem while missing another that affects the same column.
How to Find and Handle Missing Values in Excel
Missing values in Excel often appear as blank cells, but they may also appear as placeholders such as N/A, -99, Unknown, or Missing. That is why visual inspection alone is not enough.
A useful first step is to apply filters to each column and scan for blanks or unusual placeholder labels. You can also use Go To Special to highlight blank cells quickly.
In many projects, the response depends on the variable. If a few rows are missing a non-critical field, those cells may be left as blanks or labeled consistently. If an important numeric variable has too many missing entries, that column may need a more careful decision before analysis. In some cases, the rows are removed. In others, the missing values are flagged for later treatment in a statistical tool.
The important part is consistency. A column should not mix blanks, N/A, and Unknown if they all mean the same thing.
How to Remove Duplicates in Excel
Duplicate rows can inflate totals, distort counts, and make the dataset appear larger than it really is. Excel provides a direct tool for handling this.
The Remove Duplicates feature under the Data tab is often the fastest option. It allows duplicates to be checked across all selected columns or only specific fields such as respondent ID, invoice number, or email address.
This is especially useful in survey exports, lists of transactions, attendance sheets, and downloaded records where the same row may appear more than once after merging or repeated extraction.
Before removing duplicates, it is usually safer to keep a copy of the original file or sheet. That way the cleaned version remains traceable to the raw data.
How to Clean Text in Excel
Text inconsistency is one of the most common reasons categories become unreliable. A column may contain male, Male, M, and m even though they all refer to the same category. Location names may include stray spaces. Product labels may differ only because of capitalization.
Excel handles this well with a combination of functions such as TRIM, UPPER, LOWER, PROPER, and SUBSTITUTE.
For example:
TRIM(A2)removes extra spacesLOWER(A2)converts text to lowercaseUPPER(A2)converts text to uppercasePROPER(A2)changes text to title case
These are useful when cleaning names, locations, categories, and identifiers. Once the text has been standardized, pivot tables, counts, and filters become more reliable.
How to Standardize Categories in Excel
Some category columns need more than trimming and case conversion. A value such as M should not remain separate from Male if they mean the same thing. The same applies to categories such as Yes, Y, and yes.
One practical approach is to use Find and Replace for obvious inconsistencies. Another is to create a new helper column with an IF or IFS formula that maps different entries into one consistent label.
For example, a helper column might be used to convert all variants of gender into one standard form before the old column is replaced. This is often safer than editing values directly in the raw column, especially when the dataset is large.
That kind of cleanup improves both descriptive summaries and later statistical analysis.
How to Convert Numbers Stored as Text in Excel
A very common spreadsheet problem is numbers stored as text. These values often look numeric but do not behave like numbers in formulas, charts, or statistical summaries.
Signs of this problem include:
- numbers aligned differently from true numeric cells
- green warning triangles
- formulas returning unexpected results
- sorting that behaves like text instead of numbers
Excel offers several ways to fix this. The warning icon may allow direct conversion. The Text to Columns tool can also help. In other cases, multiplying by 1, using VALUE(), or applying Paste Special with multiplication can convert the values correctly.
Once numeric columns are truly numeric, calculations become much more dependable.
How to Clean Dates in Excel
Dates are one of the most common sources of spreadsheet errors. A single date column may contain real Excel dates, text values that look like dates, inconsistent regional formats, or invalid entries.
The first step is to check whether Excel recognizes the values as dates. If filtering or sorting produces strange results, the column may contain a mixture of text and valid dates.
Useful tools here include:
- cell formatting
- Text to Columns
DATE()DATEVALUE()YEAR(),MONTH(), andDAY()
Once the date column is standardized, time-based filtering, grouping, and reporting become far easier. This is especially important in research logs, financial sheets, project tracking files, and survey data.
How to Split or Combine Columns in Excel
Some datasets arrive with too much information packed into one cell. A full name may need to be separated into first and last name. A location field may combine city and country. In other cases, values spread across columns need to be merged into one usable field.
Excel handles splitting well with Text to Columns, especially when the entries are separated by spaces, commas, tabs, or other clear delimiters.
For combining values, formulas such as A2 & " " & B2 or TEXTJOIN() are useful.
This is one of the most practical parts of data cleaning because it changes the structure of the file into something more usable for analysis.
How to Review Outliers and Invalid Values in Excel
Not every unusual value is a mistake, but every unusual value deserves a closer look. Some outliers are genuine. Others are entry errors.
In Excel, a quick review often begins with sorting the column from smallest to largest or largest to smallest. Conditional formatting can also help flag unusual values. Basic summary formulas such as MIN, MAX, AVERAGE, and MEDIAN help show whether a value is wildly out of range.
If an age column contains values such as -4 or 250, those entries clearly need attention. If a satisfaction score is meant to run from 1 to 5, a value of 17 is likely a data-entry problem rather than a true outlier.
This stage becomes especially important before any formal modeling or testing because invalid values can quietly distort the final conclusions.
How to Use Find and Replace for Fast Cleanup
Find and Replace is one of the quickest tools for targeted cleanup in Excel. It works especially well for:
- removing extra symbols
- standardizing repeated labels
- replacing placeholders such as
N/Aor-99 - correcting recurring entry errors
It is powerful, but it should be used carefully. A careless replacement can change values that should not be touched. That is why it is often safer to test the replacement on a copy of the dataset or review one column at a time.
How to Use Filters and Conditional Formatting for Data Cleaning
Filters are essential in Excel cleaning because they make unusual entries easy to isolate. Instead of scanning hundreds or thousands of rows manually, filters let you view blanks, rare categories, repeated values, or suspicious entries much faster.
Conditional formatting adds another layer by highlighting duplicates, extreme values, or values outside a rule you define. Together, filtering and conditional formatting often reveal the exact places where the data structure is weakening.
This is particularly helpful in large administrative files, survey exports, and tracking sheets where visual patterns matter.
Example of a Practical Excel Cleaning Sequence
A practical Excel cleaning sequence often looks like this:
- Save a copy of the raw file
- Remove blank rows and merged cells
- Standardize column names
- Filter each column and inspect missing values
- Remove duplicate rows
- Clean text with
TRIM,LOWER,UPPER, orPROPER - Standardize category labels
- Convert numbers stored as text
- Standardize dates
- Sort key numeric fields to inspect unusual values
- Save the cleaned version separately
This kind of structure makes the cleaning process easier to repeat and easier to explain later.
Common Mistakes When Cleaning Data in Excel
One common mistake is editing the raw file directly without keeping a backup. Another is fixing visible problems while missing hidden issues such as numbers stored as text or inconsistent date types. A third is applying Find and Replace too broadly and accidentally changing valid values.
Some spreadsheets also become harder to trust because the cleaning process is done partly in formulas, partly manually, and partly without any record of what changed. The strongest workflow is one that stays clear and traceable from the original file to the cleaned file.
How Clean Excel Data Supports Better Analysis
Once the data are clean, almost every later step improves. Pivot tables become more accurate. Charts become easier to trust. Summaries become more stable. Statistical work becomes easier to defend. Even simple filtering becomes more meaningful when the categories and formats are consistent.
That is why cleaning in Excel is not a minor preparatory task. It is part of the analysis itself. Projects that later move into data analysis help, research statistics help, or full statistical analysis help usually become much easier once the spreadsheet has already been cleaned properly.
If your Excel file is still messy and the next stage of analysis feels blocked, Request Quotes Now.
FAQ: How to Clean Data in Excel
What is the first step in cleaning data in Excel?
The first step is usually to inspect the structure of the dataset, review the headers, apply filters, and identify obvious problems such as blanks, duplicates, and inconsistent formats.
How do you remove duplicates in Excel?
Use the Remove Duplicates tool under the Data tab. It can check duplication across the full row or based on selected columns.
How do you clean text in Excel?
Common functions include TRIM, LOWER, UPPER, PROPER, and SUBSTITUTE. These help remove extra spaces and standardize text values.
How do you fix numbers stored as text in Excel?
Excel can convert them through warning icons, Text to Columns, VALUE(), or multiplication by 1, depending on the case.
How do you clean dates in Excel?
Check whether Excel recognizes the values as real dates. Then use formatting tools, Text to Columns, or date functions such as DATEVALUE() where needed.
How do you find missing values in Excel?
Filters, Go To Special, and consistent review of placeholder labels help identify blanks and missing entries.
Why is data cleaning important before analysis?
Because dirty data can distort totals, summaries, models, charts, and final conclusions. Clean data make the results more reliable.
Can Excel be used for serious data cleaning?
Yes. Excel is very useful for many data cleaning tasks, especially in small to medium datasets, although larger or more complex projects may later move into tools such as R or Python.
Final Thoughts
Knowing how to clean data in Excel is one of the most practical skills in data preparation and analysis. A clean spreadsheet is easier to trust, easier to summarize, and much easier to use in later reporting or statistical work. Once the categories are consistent, the dates are valid, the duplicates are removed, and the formats are correct, the rest of the workflow becomes much smoother.
If your Excel dataset needs cleaning before analysis, reporting, or modeling, Request Quotes Now for expert support with data preparation, interpretation, and statistical analysis.