How to Clean Data in R
A dataset can look usable and still cause problems the moment analysis begins. Dates may be stored as text, categories may be written in several different ways, missing values may appear as blanks or custom labels, and numeric columns may quietly contain symbols that prevent proper calculation. None of those issues are unusual. In fact, they are common enough to shape the quality of the final results more than many people expect.
That is why learning how to clean data in R matters. Clean data make summaries more reliable, charts easier to trust, and models easier to interpret. When the structure is consistent and the values are properly formatted, the rest of the work becomes more stable. In dissertations, research projects, assignments, reports, and business analysis, that first stage often decides whether the later results feel solid or fragile.
R is especially useful for this because the cleaning process can be written as a workflow instead of handled manually cell by cell. That makes it easier to repeat, easier to review, and much easier to apply to larger datasets. This is one reason data preparation often sits at the center of broader data analysis help, research statistics help, and full statistical analysis help.
If your dataset is ready for analysis but still looks inconsistent or messy, Request Quotes Now for help with cleaning, structuring, and preparing the data properly.
What Data Cleaning in R Includes
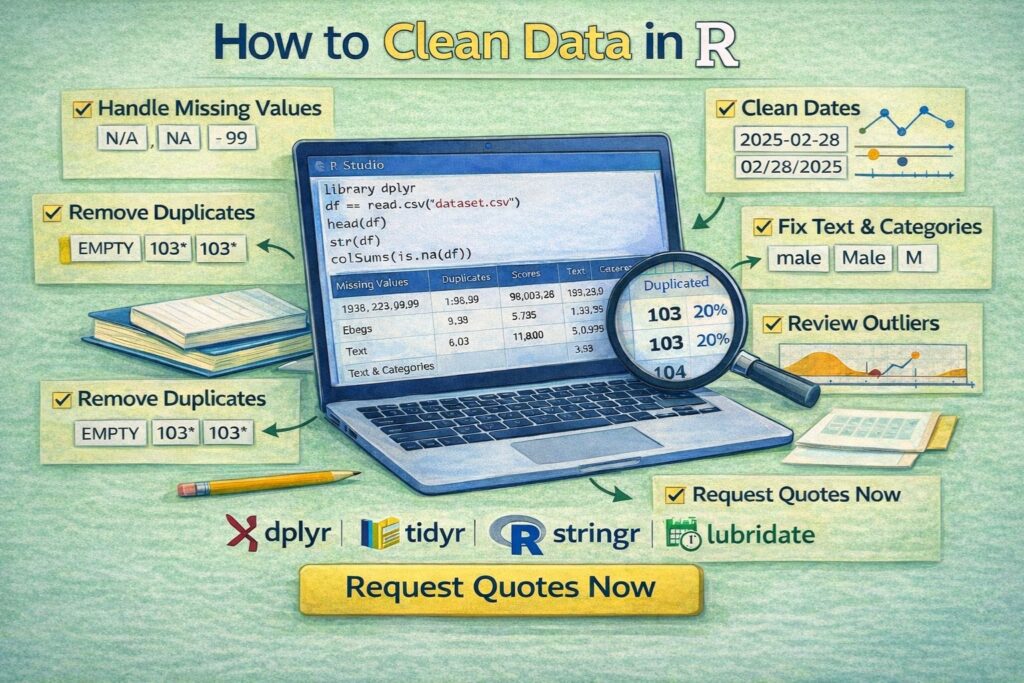
Data cleaning in R usually involves reviewing the structure of the dataset, checking missing values, removing duplicates, fixing inconsistent text entries, converting columns into the correct data types, standardizing dates, checking invalid values, and making the dataset easier to analyze.
In practical terms, the goal is not to make the data look perfect. The goal is to make the dataset accurate, consistent, and ready for valid statistical work. That may mean converting a character column into numeric form, correcting a date column, combining category labels that refer to the same thing, or removing repeated records that would otherwise distort totals and averages.
Most of this work is done with packages such as dplyr, tidyr, stringr, lubridate, and sometimes janitor. Together, they make data cleaning in R more efficient and much easier to read than manual editing.
Why Data Cleaning Matters Before Analysis
Dirty data can change the results quietly. A frequency table may count one category four different ways because the labels were entered inconsistently. A model may fail because a numeric variable is stored as text. A mean may shift because one impossible value was left in the column. A dataset may appear larger than it really is because duplicate rows were never removed.
These are not small formatting problems. They affect conclusions.
That is why data cleaning belongs before regression, hypothesis testing, forecasting, dashboards, or even simple descriptive summaries. Work that later moves into inferential statistics help or deeper research statistics help becomes much easier when the dataset has already been cleaned properly.
Common Data Problems in R Datasets
Most messy datasets repeat the same patterns.
| Problem | What it looks like |
|---|---|
| Missing values | NA, blank cells, empty strings, placeholder labels |
| Duplicate rows | Same record repeated more than once |
| Inconsistent text | Nairobi, nairobi, NAIROBI |
| Wrong data types | Numbers stored as characters |
| Mixed date formats | 2026-04-10, 10/04/2026, April 10, 2026 |
| Invalid values | Negative ages, impossible scores, wrong scales |
| Untidy column names | Spaces, symbols, inconsistent capitalization |
| Category drift | Same category entered in several different ways |
Once these issues are handled, the dataset becomes much easier to summarize, model, and report.
A Strong Data Cleaning Workflow in R
A good workflow usually starts with inspection. Before changing anything, it helps to review the first rows, check the structure, and look for missing values.
library(dplyr)
df <- read.csv(“data.csv”)
head(df)
str(df)
summary(df)
colSums(is.na(df))
That first pass already reveals a great deal. head() shows how the data look. str() shows the variable types. summary() highlights basic patterns and missingness. colSums(is.na(df)) shows where missing values are concentrated.
That is usually the point where the real cleaning priorities become visible.
How to Handle Missing Values in R
Missing values are one of the most common data cleaning issues. In R, they are often stored as NA, but they may also appear as blank strings or custom labels such as Missing, N/A, or Unknown.
A quick count of missing values by column looks like this:
If a few rows are missing a key variable, removing those rows may be reasonable:
df <- df %>% filter(!is.na(income))
If the variable is numeric and the missingness is limited, replacing missing values with the median may be more practical:
df$income[is.na(df$income)] <- median(df$income, na.rm = TRUE)
If missing text values should be labeled explicitly:
df$gender[is.na(df$gender)] <- "Unknown"
The decision depends on the variable and the purpose of the analysis. A good cleaning step should make sense statistically, not just technically.
How to Remove Duplicates in R
Duplicate records can inflate totals, distort averages, and make the dataset look larger than it really is. Sometimes the duplicated rows are exact matches. Sometimes the duplication only matters for a key field such as respondent ID or transaction number.
To remove exact duplicate rows:
df <- df %>% distinct()
To remove duplicates based on a specific identifier:
df <- df %>% distinct(respondent_id, .keep_all = TRUE)
How to Standardize Text Values in R
Text inconsistency is one of the most common reasons categories become harder to analyze. The same location or gender label may be recorded in several forms, which makes group summaries unreliable until those values are standardized.
Using stringr, a clean approach looks like this:
library(stringr)
df$country <- df$country %>%
str_trim() %>%
str_to_lower()
That turns values such as US, United State, and UNITED STATE into one consistent form.
You can also recode inconsistent categories directly with dplyr:
mutate(gender = case_when(
gender %in% c(“m”, “male”, “Male”) ~ “Male”,
gender %in% c(“f”, “female”, “Female”) ~ “Female”,
TRUE ~ gender
))
That kind of cleanup makes later summaries and models much more dependable.
How to Convert Data Types in R
A dataset often contains variables stored in the wrong format. Numeric variables may be character strings. Dates may still be plain text. Categorical variables may need to be converted to factors.
To convert a character column to numeric:
df$score <- as.numeric(df$score)
If the column contains commas or extra symbols, those may need to be removed first:
df$income <- as.numeric(gsub(",", "", df$income))
To convert a variable into a factor:
How to Clean Dates in R
Date columns often arrive in mixed or inconsistent formats. Once a date is cleaned properly, the dataset becomes much easier to filter, sort, and summarize over time.
The lubridate package is especially useful here.
df$exam_date <- ymd(df$exam_date)
df$year <- year(df$exam_date)
df$month <- month(df$exam_date)
This is especially useful in time-based reports, surveys, transaction records, and research datasets where periods matter.
How to Clean Column Names in R
Messy column names make a dataset harder to work with than necessary. Spaces, punctuation, and inconsistent capitalization often slow the workflow down.
The janitor package is a simple way to standardize them:
library(janitor)
df <- df %>% clean_names()
That turns column names into a cleaner, more consistent format such as student_age, exam_score, and department_name.
A clean naming structure makes the rest of the code much easier to read and maintain.
How to Review Outliers and Invalid Values in R
Not every extreme value is a mistake, but every unusual value deserves attention. Some are real outliers. Others are data-entry errors.
A quick review can begin with basic summaries:
summary(df$age)
df <- df %>%
mutate(age = ifelse(age < 0 | age > 100, NA, age))
For a visual check, a boxplot can help:
How to Clean Strings With Pattern Matching in R
Some text columns need more than trimming and case conversion. Imported forms, scraped data, and manually entered records often include symbols or repeated spaces that need targeted cleanup.
To remove extra spaces:
df$name <- str_squish(df$name)
To remove non-numeric characters from a phone number:
df$phone <- gsub("\\D", "", df$phone)
These small fixes can make a big difference in structured reporting and later matching or merging tasks.
Example of an End-to-End Data Cleaning Workflow in R
A compact workflow might look like this:
library(dplyr)
library(stringr)
library(lubridate)
library(janitor)

df <- read.csv("students.csv") %>%
clean_names() %>%
distinct(student_id, .keep_all = TRUE) %>%
mutate(
gender = case_when(
gender %in% c("m", "male", "Male") ~ "Male",
gender %in% c("f", "female", "Female") ~ "Female",
TRUE ~ gender
),
exam_date = dmy(exam_date),
score = as.numeric(score),
age = ifelse(age < 0 | age > 100, NA, age)
)

df$score[is.na(df$score)] <- median(df$score, na.rm = TRUE)

str(df)
summary(df)
This kind of sequence turns a messy raw file into a dataset that is much easier to analyze and report.
Common Mistakes When Cleaning Data in R
One common mistake is changing the data before inspecting the structure carefully. Another is removing too many rows without checking how much information is being lost. A third is cleaning values manually outside the code, which makes the workflow harder to repeat later.
Another issue appears when only the obvious columns are cleaned while inconsistent categories, duplicate IDs, and wrong data types are ignored. In larger projects, those overlooked details often create problems much later.
The strongest cleaning process is one that remains visible and reproducible from the raw file to the final dataset.
How Data Cleaning in R Supports Better Statistical Work
Clean data improve everything that follows. Descriptive statistics become more reliable. Group comparisons become easier to trust. Charts become more accurate. Regression, ANOVA, correlation, and other analyses begin from a better foundation.
That is why data cleaning in R is rarely a side task. It is part of the analysis itself. Work that later moves into data analysis help, inferential statistics help, or broader statistical analysis help usually reads much more clearly once the dataset has already been cleaned properly.
If the data structure still feels disorganized and the analysis cannot move forward confidently, Request Quotes Now.
FAQ: How to Clean Data in R
What package is best for cleaning data in R?
dplyr is one of the most useful packages for filtering, transforming, and recoding data. tidyr, stringr, lubridate, and janitor are also widely used in data cleaning workflows.
How do you check missing values in R?
A common approach is colSums(is.na(df)), which shows the number of missing values in each column.
How do you remove duplicate rows in R?
distinct() from dplyr is commonly used to remove duplicates, either across the full dataset or based on a key variable such as an ID.
How do you clean text columns in R?
Text columns are often cleaned with functions such as str_trim(), str_to_lower(), str_to_upper(), str_squish(), and case_when() for recoding categories.
How do you convert text to numeric in R?
as.numeric() is commonly used, although unwanted characters such as commas may need to be removed first with gsub().
How do you clean dates in R?
The lubridate package is commonly used to convert text values into dates with functions such as ymd(), dmy(), and mdy().
Should missing values be dropped or filled?
That depends on the variable, the amount of missingness, and the purpose of the analysis. Some situations call for deletion, while others are better handled through imputation or clear labeling.
Why is data cleaning important before analysis?
Because dirty data can distort descriptive summaries, tests, visualizations, and models. Clean data make the final results more reliable.
Final Thoughts
Knowing how to clean data in R is one of the most practical skills in data analysis. It turns a messy dataset into something consistent, usable, and ready for serious work. Once the categories are standardized, the missing values are reviewed properly, the dates are cleaned, and the column types are corrected, the analysis becomes much easier to trust.
If your R dataset needs cleaning before analysis, modeling, or reporting, Request Quotes Now for expert help with preparation, interpretation, and statistical analysis.