
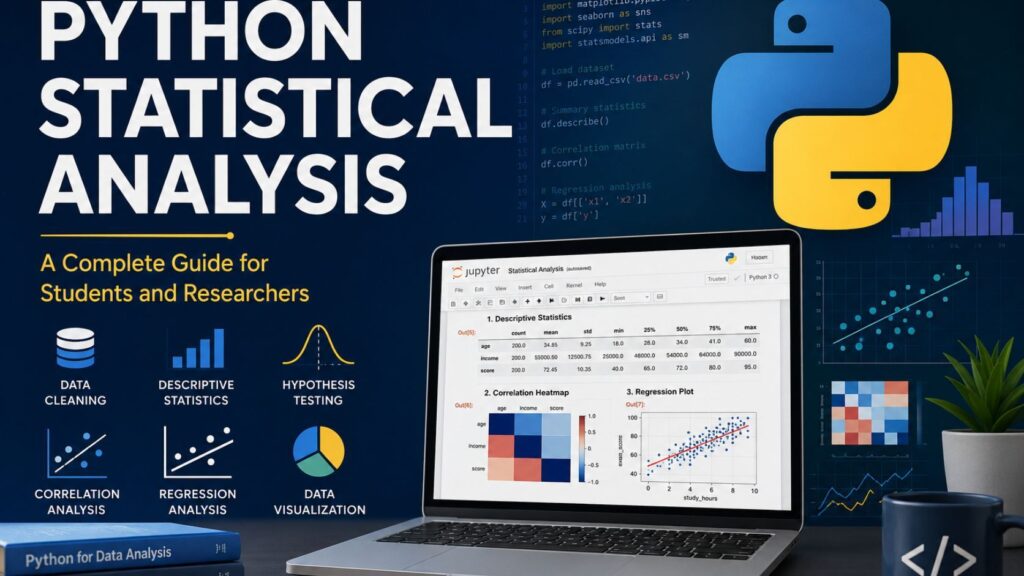
Python statistical analysis is one of the most powerful ways to clean, analyze, visualize, and interpret data for academic, business, and professional projects. Whether you are working on a dissertation, thesis, research paper, survey dataset, business report, or analytics project, Python can help you move from raw data to meaningful statistical results.
With Python, you can perform data cleaning, descriptive statistics, hypothesis testing, regression analysis, data visualization, predictive modeling, and results interpretation in one flexible environment. Many students and researchers also use Jupyter Notebook because it allows them to combine code, tables, charts, outputs, and written explanations in one organized file.
For students, researchers, and professionals, Python is especially useful because it supports repeatable analysis. Instead of doing the same calculations manually, you can write code once, check your work, rerun the analysis, and produce cleaner results. This makes Python a strong choice for dissertation data analysis, thesis research, business analytics, survey analysis, and quantitative research projects.
If you need accurate, well-documented, and research-ready statistical output, Python can be an excellent tool for your project.
Need help with Python statistical analysis? Request a Quote Now from statisticalanalysishelp.com.
What Is Python Statistical Analysis?
Python statistical analysis means using Python programming tools to examine data and produce meaningful statistical results. Instead of manually calculating values or relying only on spreadsheet formulas, Python allows users to write reusable code that can clean datasets, summarize variables, test hypotheses, build models, and create charts.
In simple terms, Python helps you turn raw data into useful findings. You can import a dataset, check for missing values, calculate descriptive statistics, run statistical tests, build regression models, create visualizations, and interpret the results.
Python statistical analysis is commonly used for:
- Academic research
- Dissertation data analysis
- Thesis data analysis
- Business reports
- Survey data analysis
- Quantitative research
- Regression modeling
- Hypothesis testing
- Data visualization
- Predictive analytics
For example, a student may use Python to analyze survey responses for a dissertation. A business analyst may use Python to study customer behavior. A researcher may use Python to examine experimental results. A professional may use Python to clean a large dataset and create visual reports.
One of the biggest advantages of Python is that the analysis process can be documented clearly. In Jupyter Notebook, users can keep the code, results, charts, and interpretation together. This makes the analysis easier to review, explain, and update.
Why Use Python for Statistical Analysis?
Python has become one of the most popular tools for statistical analysis because it is flexible, powerful, and useful for many types of data projects. It can handle small datasets, large datasets, simple calculations, advanced statistical testing, machine learning, and professional reporting.
Python is open-source and cost-effective
Python is free to use, and many of its most important data analysis libraries are also open-source. This makes it useful for students, researchers, universities, businesses, and independent professionals who need powerful statistical software without expensive licensing fees.
Python works with many data formats
Python can import data from different file types, including CSV, Excel, JSON, SQL databases, and other data sources. This is helpful because real-world data often comes from different systems and formats.
A researcher may have survey results in Excel. A business analyst may have customer data in a CSV file. A student may download a secondary dataset from an online database. Python can help organize and analyze these files.
Python supports reproducible analysis
Reproducibility is one of the biggest reasons to use Python for statistical analysis. When you write code, you create a record of each step. This means the analysis can be checked, corrected, repeated, or updated later.
This is important for dissertations, theses, and research projects because supervisors or reviewers may want to understand how the results were produced.
Python is strong for data cleaning
Before running statistical tests, the dataset must be cleaned. Python can help identify missing values, remove duplicates, rename variables, fix data types, recode categories, and prepare the dataset for analysis.
Poor data cleaning can lead to incorrect results. Python helps make the cleaning process more organized and transparent.
Python is useful for visualization
Python can create charts that make statistical results easier to understand. These include histograms, boxplots, scatterplots, bar charts, line charts, heatmaps, and regression plots.
Good charts help readers understand trends, patterns, group differences, relationships, and outliers.
Python works well with Jupyter Notebook
Jupyter Notebook is one of the best environments for Python statistical analysis. It allows users to combine code, output, charts, tables, and written explanations in one file.
This is especially useful for students and researchers because it keeps the full analysis process organized from beginning to end.
Python supports advanced statistical modeling
Python can handle basic statistics, but it can also support advanced analysis. With the right libraries, you can run regression models, logistic regression, time series analysis, predictive modeling, and machine learning.
This makes Python useful for both academic research and professional data analysis.
Common Python Libraries for Statistical Analysis
Python uses libraries to perform statistical analysis. Each library has a specific purpose, and together they create a powerful data analysis environment.
pandas
pandas is one of the most important Python libraries for data analysis. It is used to import, clean, organize, filter, group, and summarize datasets.
With pandas, you can:
- Load CSV and Excel files
- Create DataFrames
- Rename columns
- Check missing values
- Filter rows
- Group data
- Create frequency tables
- Calculate summary statistics
For most Python statistical analysis projects, pandas is one of the first libraries used because it helps prepare the data before deeper analysis begins.
NumPy
NumPy is used for numerical calculations. It supports arrays, mathematical functions, and numerical operations that help other Python libraries work efficiently.
NumPy is useful for:
- Working with numerical data
- Performing mathematical calculations
- Creating arrays
- Calculating means and standard deviations
- Supporting pandas, scipy, and scikit-learn
scipy
scipy is commonly used for statistical testing. The scipy.stats module includes tools for t-tests, ANOVA, chi-square tests, correlation, probability distributions, and normality testing.
scipy can help with:
- Independent samples t-tests
- Paired samples t-tests
- One-sample t-tests
- ANOVA
- Chi-square tests
- Pearson correlation
- Spearman correlation
- Normality tests
[Insert citation: scipy Documentation]
statsmodels
statsmodels is a powerful library for statistical modeling. It is especially useful for regression analysis because it gives detailed statistical output.
statsmodels can provide:
- Regression coefficients
- Standard errors
- p-values
- Confidence intervals
- R-squared values
- Model summaries
- Logistic regression output
For dissertation and thesis research, statsmodels is very useful because the output is similar to what many researchers expect from traditional statistical software.
matplotlib
matplotlib is used to create graphs and charts in Python. It can produce histograms, scatterplots, bar charts, line charts, and other visualizations.
matplotlib is useful when you need:
- Simple charts
- Custom graph formatting
- Publication-style visuals
- Clear data presentation
[Insert citation: matplotlib Documentation]
seaborn
seaborn is built on top of matplotlib and is often used for statistical visualizations. It makes charts easier to create and often produces cleaner visual outputs.
seaborn is useful for:
- Correlation heatmaps
- Boxplots
- Histograms
- Regression plots
- Distribution plots
- Group comparison charts
scikit-learn
scikit-learn is commonly used for machine learning, but it is also useful for predictive modeling and data preprocessing.
scikit-learn can help with:
- Train-test splits
- Data preprocessing
- Regression models
- Classification models
- Model evaluation
- Predictive analytics
Jupyter Notebook
Jupyter Notebook is not a statistical library, but it is one of the most useful tools for Python statistical analysis. It lets users combine code, outputs, charts, tables, and written explanations in one document.
For students and researchers, Jupyter Notebook is helpful because it makes the analysis easier to follow. It also allows the work to be shared, reviewed, and updated.
Types of Statistical Analysis You Can Perform in Python
Python can be used for many types of statistical analysis. The right method depends on the research question, variables, dataset, and purpose of the project.
Descriptive Statistics
Descriptive statistics summarize the main features of a dataset. They help explain what the data looks like before deeper testing begins.
Common descriptive statistics include:
- Mean
- Median
- Mode
- Standard deviation
- Variance
- Minimum
- Maximum
- Range
- Skewness
- Kurtosis
For example, a student analyzing survey data may use descriptive statistics to summarize age, income, satisfaction scores, test scores, or performance ratings.
Frequency Analysis
Frequency analysis is used to summarize categorical variables. This includes counts and percentages.
Frequency analysis can answer questions such as:
- How many respondents selected each answer?
- What percentage of participants belong to each group?
- Which category appeared most often?
- How are responses distributed across demographic groups?
Frequency tables are common in dissertation and thesis results because they help describe the sample.
Correlation Analysis
Correlation analysis examines the relationship between two variables. Python can calculate Pearson correlation for linear relationships and Spearman correlation for ranked or non-normal data.
Correlation analysis can help answer questions such as:
- Is study time related to exam performance?
- Is customer satisfaction related to loyalty?
- Is income related to spending behavior?
- Is employee engagement related to productivity?
A correlation heatmap can also show relationships among multiple variables at once.
T-tests
T-tests compare means. Python can perform one-sample, independent samples, and paired samples t-tests.
A t-test may be used when:
- Comparing two independent groups
- Comparing before-and-after scores
- Testing whether a sample mean differs from a known value
For example, a researcher may use an independent samples t-test to compare satisfaction scores between two groups.
ANOVA
ANOVA is used when comparing the means of three or more groups. Python can run one-way ANOVA and support post-hoc testing when needed.
ANOVA may be used to test questions such as:
- Do satisfaction scores differ across age groups?
- Do test scores differ across teaching methods?
- Does performance differ across departments?
Chi-square Tests
Chi-square tests are used with categorical variables. They help determine whether two categorical variables are associated.
For example:
- Is gender associated with product preference?
- Is education level associated with employment status?
- Is treatment group associated with outcome category?
Python can create cross-tabulations and run chi-square tests using pandas and scipy.
Regression Analysis
Regression analysis examines how one or more independent variables predict a dependent variable. Python regression analysis is commonly done with statsmodels.
Regression output may include:
- Coefficients
- Standard errors
- p-values
- Confidence intervals
- R-squared
- Adjusted R-squared
- Model fit statistics
Regression is widely used in dissertations, business analysis, finance, economics, psychology, education, healthcare, and social science research.
Logistic Regression
Logistic regression is used when the outcome variable is binary, such as yes/no, pass/fail, purchase/no purchase, or success/failure.
Examples include:
- Predicting whether a customer will churn
- Predicting whether a student will pass
- Predicting whether a patient has a condition
- Predicting whether a respondent supports a policy
Python can run logistic regression using statsmodels or scikit-learn.
Time Series Analysis
Time series analysis is used when data is collected over time. This may include sales data, stock prices, website traffic, monthly revenue, inflation, or demand patterns.
Python can help with:
- Trend analysis
- Seasonality checks
- Forecasting
- Moving averages
- Time-based visualization
Data Visualization
Data visualization helps communicate statistical findings clearly. Python can create:
- Histograms
- Boxplots
- Scatterplots
- Bar charts
- Line charts
- Heatmaps
- Regression plots
Good visualizations make it easier to understand patterns, group differences, outliers, and relationships.
Predictive Modeling
Python can also move beyond traditional statistics into predictive modeling. With scikit-learn, analysts can build models that predict future outcomes based on existing data.
Predictive modeling is useful in business analytics, healthcare, marketing, finance, education, and operations.
Python Statistical Analysis Workflow
A strong Python statistical analysis project should follow a clear workflow. This helps reduce mistakes and makes the final results easier to understand.
- Define the research question
Start by identifying what you want to know. A clear research question helps determine the correct statistical test. - Import the dataset
Load the data into Python using pandas. Common file types include CSV, Excel, and database exports. - Clean the data
Check for errors, duplicates, inconsistent formatting, and incorrect values. - Check missing values
Identify missing data and decide whether to remove, replace, or handle it using another method. - Explore variables
Review variable types, categories, distributions, and basic patterns. - Run descriptive statistics
Calculate means, standard deviations, frequencies, percentages, minimums, and maximums. - Check assumptions
Some statistical tests require assumptions such as normality, independence, equal variance, or linearity. - Select the correct statistical test
Choose the test based on your research question, variable types, number of groups, and assumptions. - Run the analysis
Use Python libraries such as scipy or statsmodels to perform the test. - Create tables and charts
Present results using clean tables and visuals. - Interpret the results
Explain what the results mean in plain language. Do not only report numbers. - Report the findings
Prepare research-ready explanations, tables, figures, and conclusion statements..
Example: Basic Python Statistical Analysis in Jupyter Notebook
Below is a beginner-friendly example of how Python statistical analysis may start in Jupyter Notebook.
# Import the main Python libraries for data analysis
import pandas as pd
import numpy as np
import matplotlib.pyplot as plt
import seaborn as sns
from scipy import stats
import statsmodels.api as sm
This code imports the main libraries used for data cleaning, statistical testing, modeling, and visualization.
# Load a dataset from a CSV file
df = pd.read_csv("dataset.csv")

# View the first five rows
df.head()
This loads the dataset and displays the first few rows so you can understand the structure of the data.
# Check the size of the dataset
df.shape

# View column names and data types
df.info()
This helps you see how many rows and columns are in the dataset and whether variables are stored as numbers, text, dates, or categories.
# Check for missing values
df.isnull().sum()
This shows how many missing values exist in each column. Missing values should be reviewed before running statistical tests.
# Run descriptive statistics for numerical variables
df.describe()
This produces summary statistics such as count, mean, standard deviation, minimum, maximum, and quartiles.
# Create a frequency table for a categorical variable
df["gender"].value_counts()

# Create a percentage table
df["gender"].value_counts(normalize=True) * 100
This is useful for summarizing categorical variables such as gender, education level, department, group, or response category.
# Run a correlation matrix for numerical variables
correlation_matrix = df.corr(numeric_only=True)
correlation_matrix
This shows relationships between numerical variables.
# Create a simple correlation heatmap
plt.figure(figsize=(8, 6))
sns.heatmap(correlation_matrix, annot=True)
plt.title("Correlation Heatmap")
plt.show()
A heatmap helps visualize the strength and direction of relationships between variables.
# Create a histogram for a numerical variable
plt.hist(df["score"], bins=10)
plt.xlabel("Score")
plt.ylabel("Frequency")
plt.title("Distribution of Scores")
plt.show()
A histogram helps you see the distribution of a variable and identify whether values are normally distributed, skewed, or unusual.
Python Code Examples for Common Statistical Tests
Descriptive Statistics in Python
# Descriptive statistics for selected variables
df[["age", "income", "score"]].describe()
This provides the mean, standard deviation, minimum, maximum, and quartiles for selected numerical variables.
# Additional descriptive statistics
mean_score = df["score"].mean()
median_score = df["score"].median()
std_score = df["score"].std()
variance_score = df["score"].var()

mean_score, median_score, std_score, variance_score
These commands calculate specific descriptive statistics individually.
Correlation in Python
# Pearson correlation between two variables
df["study_hours"].corr(df["exam_score"])
This calculates the relationship between study hours and exam score.
# Pearson correlation test with p-value
correlation, p_value = stats.pearsonr(df["study_hours"], df["exam_score"])

correlation, p_value
The correlation coefficient shows the strength and direction of the relationship. The p-value helps determine whether the relationship is statistically significant.
T-test in Python
# Separate scores by group
group_a = df[df["group"] == "A"]["score"]
group_b = df[df["group"] == "B"]["score"]

# Independent samples t-test
t_statistic, p_value = stats.ttest_ind(group_a, group_b, nan_policy="omit")

t_statistic, p_value
An independent samples t-test compares the mean score between two independent groups. If the p-value is below the selected significance level, usually 0.05, the difference between the groups may be statistically significant.
ANOVA in Python
# Separate scores by three groups
group_1 = df[df["teaching_method"] == "Method 1"]["score"]
group_2 = df[df["teaching_method"] == "Method 2"]["score"]
group_3 = df[df["teaching_method"] == "Method 3"]["score"]

# One-way ANOVA
f_statistic, p_value = stats.f_oneway(group_1, group_2, group_3)

f_statistic, p_value
ANOVA tests whether there is a statistically significant difference among three or more group means. If the result is significant, post-hoc testing may be needed to identify which groups differ.
Chi-square Test in Python
# Create a cross-tabulation table
table = pd.crosstab(df["gender"], df["product_preference"])

# Run chi-square test
chi2, p, dof, expected = stats.chi2_contingency(table)

chi2, p, dof
A chi-square test examines whether two categorical variables are associated. The p-value helps determine whether the relationship is statistically significant.
Linear Regression in Python
# Define independent and dependent variables
X = df[["study_hours", "attendance", "prior_score"]]
y = df["exam_score"]

# Add a constant to the model
X = sm.add_constant(X)

# Fit the regression model
model = sm.OLS(y, X).fit()

# Display the regression results
print(model.summary())
Linear regression helps predict a continuous outcome variable using one or more independent variables. The output includes coefficients, p-values, confidence intervals, and R-squared.
In simple terms:
- Coefficient shows the expected change in the dependent variable when the predictor increases by one unit.
- p-value shows whether the predictor is statistically significant.
- R-squared shows how much variation in the dependent variable is explained by the model.
- Confidence interval shows the range of likely values for the coefficient.
Logistic Regression in Python
# Define independent and dependent variables
X = df[["age", "income", "satisfaction_score"]]
y = df["purchase_made"]

# Add a constant
X = sm.add_constant(X)

# Fit logistic regression model
logit_model = sm.Logit(y, X).fit()

# Display results
print(logit_model.summary())
Logistic regression is used when the outcome variable has two categories, such as yes/no or purchase/no purchase. The results can help explain which variables are associated with the likelihood of an outcome.
Data Visualization in Python
# Boxplot comparing scores by group
sns.boxplot(x="group", y="score", data=df)
plt.title("Score Comparison by Group")
plt.show()
A boxplot helps compare distributions across groups.
# Scatterplot showing relationship between two variables
sns.scatterplot(x="study_hours", y="exam_score", data=df)
plt.title("Study Hours and Exam Score")
plt.show()
A scatterplot helps show whether two numerical variables are related.
# Regression plot
sns.regplot(x="study_hours", y="exam_score", data=df)
plt.title("Regression Plot: Study Hours and Exam Score")
plt.show()
A regression plot adds a trend line to show the general relationship between two variables.
Python for Dissertation, Thesis, and Research Data Analysis
Python can be especially useful for dissertation, thesis, and academic research projects. Many students need more than basic calculations. They need clean datasets, correct statistical tests, clear tables, accurate interpretation, and results that match their research questions.
Python can support research projects involving:
- Survey data
- Experimental data
- Secondary datasets
- Quantitative research
- Hypothesis testing
- Regression models
- Chapter 4 results
- Tables and figures
- Methodology support
- Jupyter Notebook files
For example, a dissertation student may collect survey responses and need to analyze demographic variables, test relationships among variables, and run regression models. Python can help clean the survey data, calculate descriptive statistics, create frequency tables, run correlation analysis, and build regression models.
A thesis student may need to compare groups. If there are two groups, a t-test may be appropriate. If there are three or more groups, ANOVA may be better. Python can run these tests and produce outputs that can be interpreted for academic reporting.
A researcher using secondary data may need to clean a large dataset, recode variables, remove missing values, and build statistical models. Python is useful because it can handle repeatable data preparation and analysis steps.
Python can also help create charts for academic writing, including demographic bar charts, correlation heatmaps, regression plots, histograms, boxplots, line charts, and group comparison charts.
However, running Python code is only part of the process. The results must also be interpreted correctly. A p-value, coefficient, confidence interval, or R-squared value needs to be explained in relation to the research question.
That is why many students and researchers seek Python data analysis help. The goal is not only to produce output but to understand what the output means.
Python Statistical Analysis vs SPSS, Excel, Stata, and R
Different statistical tools are useful for different situations. The best tool depends on the dataset, research question, statistical method, and reporting needs.
| Tool | Best For | Strengths | Limitations | When to Use It |
|---|---|---|---|---|
| Python | Data cleaning, statistical analysis, automation, visualization, machine learning | Flexible, open-source, reproducible, powerful libraries, strong for large datasets | Requires coding knowledge | Use when you need custom analysis, repeatable code, Jupyter Notebook output, advanced modeling, or automation |
| SPSS | Social science research, survey analysis, basic to intermediate statistics | User-friendly, menu-based, common in academic research | Less flexible for automation and custom workflows | Use when you need standard statistical tests with a simple interface |
| Excel | Basic data cleaning, simple calculations, charts, business reports | Easy to use, familiar, good for small datasets | Limited for advanced statistics and reproducibility | Use for simple summaries, quick tables, and basic charts |
| Stata | Econometrics, policy research, panel data, regression | Strong statistical commands, good documentation, widely used in economics | Requires specialized syntax and licensing | Use for econometric analysis, public policy data, and structured statistical workflows |
| R | Statistical programming, research, visualization, advanced statistics | Excellent for statistics, strong packages, great visualization | Can have a learning curve for beginners | Use for advanced statistical research, academic modeling, and specialized statistical methods |
Python is not always better than every tool. However, it is a strong choice when the project requires data cleaning, code-based analysis, visualization, automation, and reproducible reporting.
Common Mistakes in Python Statistical Analysis
Python is powerful, but mistakes can still happen. The quality of the results depends on the quality of the data, the correct test selection, and accurate interpretation.
Not cleaning data properly
Dirty data can lead to incorrect results. Common issues include duplicate rows, missing values, inconsistent labels, wrong data types, and impossible values.
To avoid this, review the dataset carefully before running analysis.
Ignoring missing values
Missing values can affect descriptive statistics, t-tests, regression models, and charts. Python can detect missing values, but the analyst must decide how to handle them.
Options may include removing rows, imputing values, or explaining the missing data approach.
Choosing the wrong statistical test
A common mistake is using a test that does not match the research question or variable type.
For example, a t-test is used to compare two means, while a chi-square test is used for categorical variables. Regression is used when predicting an outcome or testing relationships between variables.
Not checking assumptions
Many statistical tests have assumptions. For example, regression may require linearity, independence, normality of residuals, and equal variance. T-tests and ANOVA may require normality and homogeneity of variance.
Ignoring assumptions can weaken the analysis.
Misinterpreting p-values
A p-value does not prove that a hypothesis is true. It only helps determine whether the observed result is statistically significant under the test conditions.
Results should be explained carefully and connected to the research question.
Confusing correlation with causation
Correlation shows association, not cause and effect. If two variables are related, that does not automatically mean one causes the other.
Causal claims require stronger research design and evidence.
Not validating regression models
Regression models should be reviewed for fit, assumptions, multicollinearity, outliers, and meaningful interpretation.
A model with significant predictors may still be weak if assumptions are violated or if important variables are missing.
Using poor visualizations
Charts should make results easier to understand. Poor visuals can confuse readers or misrepresent findings.
Good charts should have clear labels, readable titles, appropriate scales, and a direct connection to the analysis.
Copying code without understanding it
Copying Python code without understanding the logic can create serious errors. Each line of code should match the dataset, variable names, and research question.
Reporting Python output without interpretation
Statistical output alone is not enough. Students and researchers must explain what the results mean. A good report connects the numbers to the research question, hypothesis, and conclusion.
When You Should Get Python Statistical Analysis Help
You may need professional Python statistical analysis help if you are unsure how to move from your dataset to correct results.
Professional support can be useful when:
- You are unsure which statistical test to use
- Your dataset has missing values or coding errors
- You need help with pandas, scipy, statsmodels, or Jupyter Notebook
- You need Python regression analysis
- You need help interpreting p-values, coefficients, or confidence intervals
- You need charts, tables, and research-ready output
- You need dissertation or thesis results explained clearly
- You need help writing up findings for Chapter 4
- You need clean, organized Jupyter Notebook output
A major challenge with Python statistical analysis is that code and statistics must work together. Even if the code runs, the analysis may still be wrong if the statistical method is not appropriate. Professional help can reduce errors and improve the clarity of the final report.
Need help with Python statistical analysis? Request a Quote Now and get support with data cleaning, Python coding, statistical testing, regression analysis, visualization, and interpretation.
How statisticalanalysishelp.com Can Support Your Python Statistical Analysis
statisticalanalysishelp.com provides support for students, researchers, professionals, and organizations that need help analyzing data using Python.
Support may include:
- Python data cleaning
- Jupyter Notebook analysis
- pandas data preparation
- scipy statistical testing
- statsmodels regression analysis
- Python charts and visualizations
- Hypothesis testing
- Dissertation data analysis
- Thesis data analysis
- Business data analysis
- Results interpretation
- Tables and figures
- Research-ready reporting
The goal is to help you produce clean, accurate, and understandable statistical results. Whether you need help selecting the correct test, fixing Python code, interpreting regression output, creating charts, or writing up results, professional support can make the process easier.
statisticalanalysishelp.com can help with clear communication, organized output, academic-friendly explanations, and confidential support for your project.