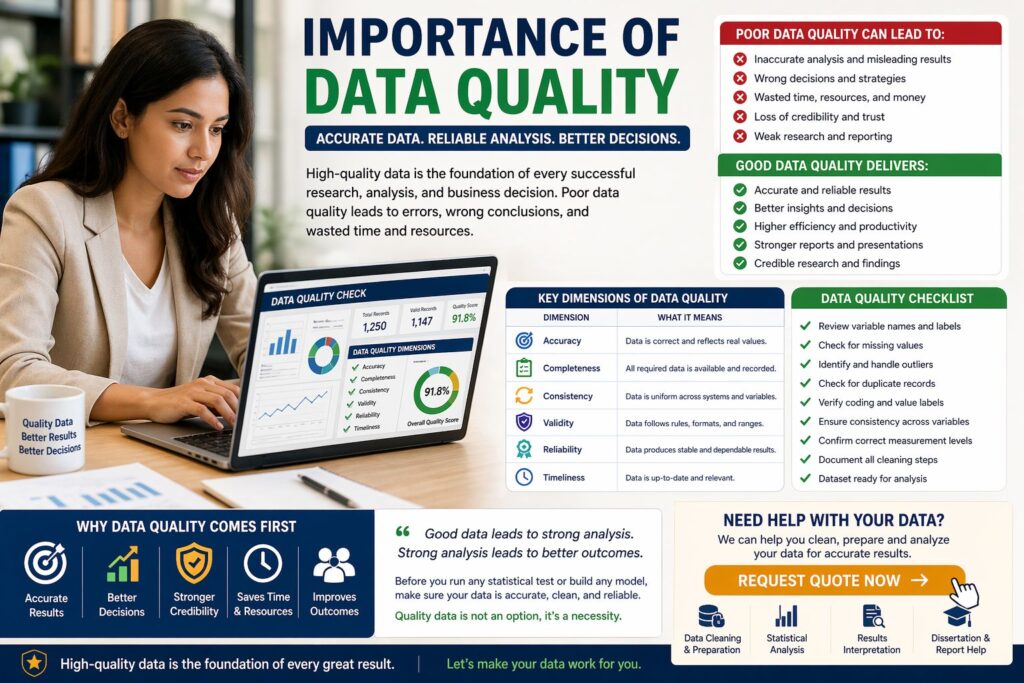
Importance of Data Quality
Data quality is one of the strongest foundations of reliable research, accurate statistical analysis, and confident decision-making. A dataset may contain hundreds or thousands of responses, but if the values are incomplete, inconsistent, duplicated, poorly coded, or not properly checked, the final results can become misleading. This is why understanding the importance of data quality matters before running any statistical test or writing any results section.
In research, data quality affects everything that follows. It affects descriptive statistics, hypothesis testing, regression models, survey analysis, dissertation findings, business reports, and interpretation. A clean and reliable dataset allows patterns to appear clearly. A weak dataset hides the truth behind errors, missing values, and inconsistencies.
Many students and researchers focus heavily on the statistical method but forget that the method depends on the data behind it. Even advanced techniques such as regression, ANOVA, factor analysis, or machine learning cannot fix poor-quality data automatically. Good analysis begins with data that is accurate, complete, consistent, and suitable for the research question.
If your dataset needs cleaning, review, preparation, or analysis support, Request Quote Now.
What Is Data Quality?
Data quality refers to the condition of a dataset and how suitable it is for analysis, reporting, or decision-making. High-quality data is accurate, complete, consistent, valid, reliable, and relevant to the purpose of the study. It gives researchers confidence that the results reflect real patterns rather than avoidable errors.
For example, a survey dataset with correct value labels, properly coded variables, minimal missing data, and reviewed outliers is easier to analyze and interpret. On the other hand, a dataset with unclear labels, duplicate responses, missing values, and inconsistent coding can weaken the entire analysis.
Data quality is not only about having a large dataset. A large dataset with many errors can be worse than a smaller dataset that has been carefully cleaned and prepared. What matters is whether the data can support valid conclusions.
This topic connects directly with data analysis help, SPSS analysis help, and how to clean data in SPSS because analysis quality depends on the strength of the dataset.
Why Data Quality Matters in Statistical Analysis
Statistical analysis depends on the assumption that the data being analyzed is suitable for the method used. If that assumption is weak, the results become weak too. Poor data quality can affect p values, coefficients, confidence intervals, regression models, means, standard deviations, and significance tests.
For example, missing values may reduce the sample size and weaken statistical power. Coding errors may place responses in the wrong group. Duplicate cases may give some respondents more influence than others. Outliers may distort mean scores and regression results. These issues can change the final conclusion of a study.
High-quality data improves the accuracy of the findings. It helps researchers explain results clearly and defend their conclusions. It also reduces the risk of revision requests from supervisors, clients, reviewers, or decision-makers.
Table 1. How Data Quality Affects Analysis
| Data quality issue | Effect on analysis | Why it matters |
|---|---|---|
| Missing values | Reduces sample size | Weakens statistical power |
| Coding errors | Misclassifies responses | Leads to wrong interpretation |
| Duplicate records | Overrepresents some cases | Biases results |
| Outliers | Distorts averages and models | Affects regression, ANOVA, and correlations |
| Inconsistent labels | Confuses interpretation | Makes reporting unclear |
| Wrong measurement level | Affects test selection | Can lead to wrong statistical methods |
Key Dimensions of Data Quality
Data quality has several important dimensions. Each one contributes to the strength of the dataset and the reliability of the final analysis.
Accuracy means the values in the dataset are correct. Completeness means the dataset has enough information for analysis. Consistency means the data follows the same coding structure across variables. Validity means values fit the expected format or range. Reliability means the data can support stable and dependable results. Timeliness means the data is current enough for the purpose of the study.
When these dimensions are strong, the dataset becomes easier to analyze and defend. When they are weak, even a carefully selected statistical test may produce unreliable findings.
Table 2. Main Dimensions of Data Quality
| Dimension | Meaning | Example |
|---|---|---|
| Accuracy | Values are correct | Age is recorded as 25, not 250 |
| Completeness | Required data is available | Key survey questions are not mostly blank |
| Consistency | Coding is uniform | Male = 1 and Female = 2 throughout the dataset |
| Validity | Values fit expected rules | Likert responses stay within 1 to 5 |
| Reliability | Data supports stable findings | Similar items measure the same construct consistently |
| Timeliness | Data is current enough | Recent data is used for current decisions |
Importance of Data Quality in Research and Dissertations
In dissertations, theses, and academic research, data quality can determine whether the findings are credible. A student may choose the right test and still produce weak results if the dataset was not checked properly. This is especially common in questionnaire-based research, where coding errors, missing responses, reverse-coded items, and inconsistent values can affect the final analysis.
Data quality also affects Chapter 4 and the results section. If the dataset is clean, the results are easier to report. Tables become clearer, interpretation becomes stronger, and conclusions become more defensible. If the dataset is poor, the results section may contain contradictions, unclear findings, or statistical outputs that do not make sense.
Good data quality supports stronger academic writing because the researcher can explain the findings with confidence. It also helps avoid unnecessary corrections during supervision or review.
Useful related pages include descriptive statistics help, hypothesis testing help, Chapter 4 results help, and dissertation data analysis help.
For example, if a dataset has missing values, incorrect codes, duplicate cases, and outliers, its quality is weak. Cleaning the data involves identifying those issues, correcting them where appropriate, documenting changes, and preparing the dataset for analysis.
Data cleaning is therefore one of the main ways to improve data quality. However, data quality also includes broader issues such as data collection design, questionnaire structure, coding rules, storage, documentation, and relevance to the research question.
Table 3. Data Quality vs Data Cleaning
| Area | Data quality | Data cleaning |
|---|---|---|
| Meaning | Condition of the dataset | Process of correcting problems |
| Main focus | Trustworthiness of data | Preparing data for analysis |
| Example | Data is accurate and complete | Missing values are checked |
| Purpose | Support reliable conclusions | Improve analysis readiness |
| Stage | Before, during, and after collection | Mainly before analysis |
How Poor Data Quality Affects Results
Poor data quality can change the direction, strength, and significance of statistical findings. This is one of the main reasons it should never be ignored.
For example, a regression model may show a predictor as significant because duplicate cases inflated the pattern. A correlation may become weaker because values were entered incorrectly. A t test may produce a misleading group difference because one group contains invalid scores. A reliability test may show poor internal consistency because reverse-coded items were not corrected.
These problems are not always visible at first glance. A dataset can look complete and still contain hidden errors. That is why data screening, cleaning, and validation are essential before analysis begins.
Table 4. Before and After Data Quality Improvement
| Problem | Before quality check | After quality check |
|---|---|---|
| Missing values | Unknown or ignored | Identified and handled |
| Outliers | Distorting results | Reviewed and documented |
| Coding errors | Wrong categories | Corrected values |
| Duplicate cases | Inflated responses | Removed or reviewed |
| Variable labels | Confusing output | Clear interpretation |
| Composite scores | Unreliable scales | Correctly prepared variables |
Importance of Data Quality in Business and Decision-Making
Data quality is not only important in academic work. It is also critical in business, healthcare, education, public policy, finance, and organizational reporting. Decision-makers rely on data to understand performance, identify trends, forecast outcomes, and allocate resources.
If the data is inaccurate, the decision can also be inaccurate. A company may invest in the wrong market segment. A hospital may misread patient trends. A university may misunderstand student performance. A business may misinterpret customer satisfaction because the dataset contained duplicate or incomplete responses.
High-quality data gives decision-makers confidence. It supports clearer dashboards, better reports, stronger forecasting, and more reliable insights. In any environment where data guides action, quality matters.
For organizations that need practical support, data analysis help and regression analysis help can support deeper interpretation and reporting.
How to Improve Data Quality
Improving data quality starts before analysis. The first step is to review the dataset structure. Variable names, labels, measurement levels, and value labels should be clear. Missing values should be identified. Outliers should be reviewed. Duplicate records should be checked. Coding should be consistent across variables.
The next step is to document every important cleaning decision. This creates transparency and helps explain what was done if questions arise later. In dissertations and research projects, this documentation can also support the methodology chapter.
Improving data quality also requires careful judgment. Missing values should not always be deleted automatically, and outliers do not necessarily need to be removed in every case. In addition, unusual responses are not always errors. The right decision depends on the research design, sample, variables, and the type of analysis being conducted.
Table 5. Data Quality Improvement Checklist
| Data quality check | Completed? |
|---|---|
| Variable names are clear | ☐ |
| Value labels are defined | ☐ |
| Missing values are reviewed | ☐ |
| Outliers are checked | ☐ |
| Duplicate cases are identified | ☐ |
| Coding is consistent | ☐ |
| Measurement levels are correct | ☐ |
| Composite scores are properly created | ☐ |
| Cleaning decisions are documented | ☐ |
| Dataset is ready for analysis | ☐ |
Common Data Quality Mistakes
One common mistake is assuming that data is ready because it has already been collected. Collection does not guarantee quality. A dataset can be complete in appearance but still contain coding errors, duplicate cases, invalid values, or poorly structured variables.
Another mistake is cleaning data without documenting the changes. This can create confusion later, especially when writing a methodology section or explaining why some cases were excluded. A clean dataset should be supported by a clear record of what was checked and changed.
A third mistake is treating data quality as a final step. It should be considered from the beginning of the research process, including survey design, variable coding, data collection, cleaning, analysis, and interpretation.
Get Expert Help Improving Data Quality
Some datasets only need basic checks. Others require deeper preparation before analysis can begin. If your data came from surveys, interviews coded into categories, Excel files, SPSS files, Google Forms, Qualtrics, secondary datasets, or business records, quality issues may not be obvious at first.
Expert support can help identify missing values, check coding errors, review outliers, clean duplicates, prepare variables, create composite scores, and make the dataset ready for analysis. This is especially useful when the data will be used for dissertations, assignments, reports, journal manuscripts, or business decisions.
If you want your dataset checked and prepared properly, Request Quote Now.
Why Choose Statistical Analysis Help
Statistical Analysis Help supports students, researchers, and professionals who need accurate, clean, and analysis-ready data. The goal is not only to run statistical tests but to make sure the dataset behind those tests is reliable.
Support can include data cleaning, data screening, variable coding, SPSS setup, missing value review, outlier detection, descriptive statistics, hypothesis testing, regression analysis, and results interpretation. This gives you a stronger foundation for analysis and reporting.
A high-quality dataset makes every later stage easier. It improves the accuracy of results, the clarity of interpretation, and the confidence of the final conclusion.
FAQ: Importance of Data Quality
What is data quality?
Data quality refers to how accurate, complete, consistent, valid, reliable, and useful a dataset is for analysis or decision-making.
Why is data quality important?
Data quality is important because poor data can lead to inaccurate results, weak interpretation, misleading conclusions, and poor decisions.
How does data quality affect statistical analysis?
It affects sample size, test accuracy, coefficients, p values, confidence intervals, regression models, and the reliability of conclusions.
What are the main dimensions of data quality?
The main dimensions include accuracy, completeness, consistency, validity, reliability, and timeliness.
Is data quality the same as data cleaning?
No. Data quality is the condition of the data. Data cleaning is the process used to improve that condition.
Why is data quality important in dissertations?
It helps ensure that the findings are valid, defensible, and suitable for academic reporting.
Can poor data quality affect regression results?
Yes. Missing values, outliers, coding errors, and duplicate cases can distort regression results and lead to misleading conclusions.
How can I improve data quality?
You can improve data quality by checking missing values, outliers, duplicates, coding, labels, measurement levels, and consistency before analysis.
Can you help improve my dataset quality?
Yes. Statistical Analysis Help can review, clean, prepare, and structure your dataset for accurate analysis and reporting.
Final Call to Action
Data quality is not a small technical issue. It is the foundation of every reliable analysis. Clean, accurate, and consistent data leads to stronger results, clearer interpretation, and more credible conclusions.
If your dataset needs review, cleaning, preparation, or analysis support, get expert help before running the final tests.