How to Report T-Test Results in APA Style
Knowing how to run a t-test is only one part of good statistical work. Many students can generate the output, identify the p value, and locate the mean scores, yet still feel unsure when it is time to write the result properly. That is where many dissertations, theses, assignments, and research reports begin to lose marks.
The difficulty is often not the test itself. The problem is presenting the result in a way that sounds clear, academic, and complete. A reader should be able to see what was compared, which group scored higher or lower, whether the difference was statistically significant, and how the finding relates to the research question.
APA-style reporting makes results easier to follow and more professional. Instead of pasting raw software output into the paper, the writer presents the evidence in a form that is polished, precise, and academically defensible. When that is done well, the results section becomes much stronger.
Quick Answer: How to Report T-Test Results in APA Style
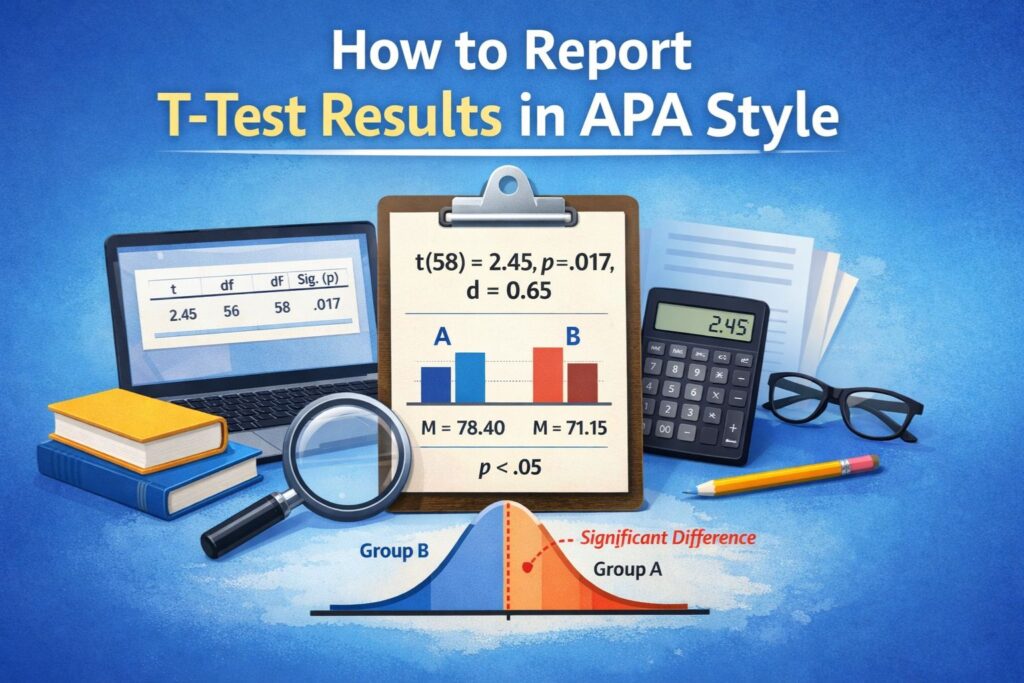
A t-test result in APA style is usually reported by presenting the mean scores, standard deviations, t statistic, degrees of freedom, p value, and the direction of the difference. Where relevant, effect size should also be included.
A standard example looks like this:
Students who attended the workshop scored significantly higher on the statistics test (M = 78.40, SD = 8.21) than students who did not attend (M = 71.15, SD = 9.03), t(58) = 3.24, p = .002, d = 0.84.
That structure is effective because it combines the descriptive and inferential results in one sentence and makes the pattern immediately clear.
What APA-Style T-Test Reporting Means
APA-style reporting is not a matter of copying the statistical table into a paragraph. It is a way of presenting findings so that the reader understands both the numbers and the meaning of the comparison.
A well-written t-test result usually includes the outcome variable, the relevant group or sample means, the standard deviations, the t value, the degrees of freedom, and the p value. In stronger reporting, the direction of the difference is stated clearly and the effect size is added to show the magnitude of the finding.
This matters because statistics alone do not explain themselves. A sentence such as “the result was significant” is not enough. A proper APA-style result allows the reader to understand what changed, where the difference occurred, and how strong that difference appears to be.
Why Weak T-Test Reporting Costs Marks
Many students produce the correct test but describe it poorly. A common problem is reporting only the p value without showing the actual means. Another is stating that a significant difference exists without explaining which group scored higher or lower. In other cases, the writing sounds too mechanical because it follows the wording of the software instead of the logic of academic reporting.
These problems make the results section look unfinished. A supervisor may feel that the student has run the test without fully understanding how to communicate the finding. Even when the statistics are correct, weak reporting can reduce the quality of the chapter or assignment.
Clear reporting improves the credibility of the result. It shows that the writer understands the comparison, the evidence, and the meaning of the finding in relation to the study.
When a T-Test Is Appropriate
A t-test is used when the goal is to compare means. The correct version depends on the design of the study and the relationship between the observations.
A one-sample t-test compares the mean of one sample with a known, expected, or benchmark value. This is often used when a sample mean is compared with a target score, scale midpoint, or policy threshold.
An independent-samples t-test compares the means of two separate groups. This is common in studies involving categories such as male and female participants, treatment and control groups, or students from two different classes.
A paired-samples t-test compares two related sets of scores. This usually happens in before-and-after studies or repeated-measures designs where the same participants are measured twice.
A t-test is not usually the right main test when more than two groups are compared. In such cases, a different analysis may be more suitable.
A Clear Formula for APA T-Test Reporting
A clean reporting pattern makes t-test writing much easier:
[Group 1] had a [higher/lower] mean score on [outcome] (M = xx.xx, SD = xx.xx) than [Group 2 or comparison value] (M = xx.xx, SD = xx.xx), t(df) = x.xx, p = .xxx, d = x.xx.
This structure works well because it gives the reader the comparison, the descriptive statistics, the test result, and the direction of the effect in one sentence. It sounds complete without becoming unnecessarily long.
Reporting a One-Sample T-Test in APA Style
A one-sample t-test compares the mean score of a single sample against a fixed value. That fixed value may be theoretical, practical, or policy-based. In research writing, the strength of the result depends on showing both the benchmark and the direction of the difference.
A polished example is:
A one-sample t-test showed that students studied significantly fewer hours per week (M = 5.82, SD = 1.21) than the recommended 7 hours, t(39) = -6.17, p < .001, d = -0.98.
This sentence works because the benchmark is clearly identified and the direction of the result is immediately visible. The negative t value fits the pattern because the sample mean was lower than the comparison value.
A one-sample t-test result is strongest when it shows not only that the sample differed from the benchmark, but also how that difference should be understood in context.
Reporting an Independent-Samples T-Test in APA Style
An independent-samples t-test is used when two different groups are compared. Because the groups are separate, the reader needs to see both group means clearly. This is also the form of t-test that appears most often in dissertations, theses, and assignments.
A strong example is:
An independent-samples t-test showed that students who attended the revision workshop scored significantly higher (M = 78.40, SD = 8.21) than students who did not attend (M = 71.15, SD = 9.03), t(58) = 3.24, p = .002, d = 0.84.
This wording is effective because it goes beyond statistical significance. It shows which group performed better and gives the descriptive values that support that conclusion.
A weaker sentence such as “there was a significant difference between the groups” leaves too much unanswered. It does not show the pattern of the result, and it forces the reader to search for the meaning in a table or output file.
In academic writing, it is much stronger to report the comparison as a complete finding rather than as a bare statistical outcome.
Reporting a Paired-Samples T-Test in APA Style
A paired-samples t-test is appropriate when the same participants are measured at two points or under two related conditions. In these cases, the writing should make the relationship between the scores clear. The result should sound like a change across time or condition, not like a comparison between unrelated groups.
A clear example is:
A paired-samples t-test showed that anxiety scores were significantly lower after the intervention (M = 14.30, SD = 4.11) than before the intervention (M = 18.05, SD = 4.68), t(29) = 4.12, p < .001, d = 0.75.
This kind of sentence is effective because it presents the before-and-after pattern clearly. The reader does not have to infer what changed. The comparison is already explained in the wording.
Paired-samples reporting is strongest when the two conditions are named clearly and the direction of change is stated directly.
Reporting a Non-Significant T-Test Result
A non-significant result still needs full reporting. In weaker writing, the result is reduced to one line such as “there was no significant difference.” That sentence is too limited because it hides the pattern of the means and gives the reader very little information.
A better result looks like this:
An independent-samples t-test showed that there was no statistically significant difference in assignment scores between students who used the study guide (M = 72.10, SD = 7.54) and those who did not (M = 70.42, SD = 8.01), t(46) = 0.76, p = .451, d = 0.22.
A non-significant result should still read like a complete finding.
What a Strong T-Test Paragraph Includes
A polished t-test paragraph normally contains the core pieces of information that a reader expects to see.
| Element | What it shows |
|---|---|
| Outcome variable | What was measured |
| Group or sample means | The pattern of the data |
| Standard deviations | How spread out the scores were |
| t statistic | The test result |
| Degrees of freedom | The model information |
| p value | Statistical significance |
| Direction of difference | Which group was higher or lower |
| Effect size | The magnitude of the difference |
When these elements appear together, the paragraph feels complete. The reader is able to understand not only whether the difference was statistically significant, but also what that difference looked like.
Writing T-Test Results From SPSS Output
SPSS provides the values needed for the result, but those values still need to be translated into academic writing. The software output is best treated as raw material rather than finished prose.
The means and standard deviations usually come from the descriptive table. The t statistic, degrees of freedom, and p value come from the main test table. Once those values are identified, the next step is to express them in a sentence that explains the comparison clearly.
The best results paragraphs do not sound like exported software text. They sound like a reasoned interpretation of evidence. Instead of mirroring the output line by line, the writing brings the evidence together and states the finding in plain academic language.
This shift from output to interpretation is what makes a results section sound polished.
Common Mistakes in APA T-Test Reporting
One frequent mistake is reporting only the p value. That tells the reader almost nothing about the actual comparison. A p value without means, standard deviations, or direction is incomplete.
Another common mistake is omitting the descriptive statistics. Without them, the reader cannot see which group performed better or how large the observed difference was in raw terms.
A third problem is failing to state the direction of the difference. If the result is significant, the paragraph should show whether one group scored higher, lower, or changed across time. Significance alone is not interpretation.
Some writers also use the wrong type of t-test. Independent and paired designs are not interchangeable, and inaccurate reporting weakens the analysis.
Another issue is writing p = 0.000. In APA style, that should be written as p < .001.
Many students also copy SPSS wording directly into the chapter. This usually sounds mechanical and unfinished. Academic reporting should explain the result rather than simply echo the software.
Finally, effect size is often ignored. A result may be statistically significant, but the effect may still be small. Including effect size gives the reader a clearer sense of practical importance.
APA-Style T-Test Examples
One-Sample T-Test Example
A one-sample t-test showed that the mean stress score of postgraduate students (M = 21.43, SD = 4.52) was significantly higher than the neutral benchmark score of 18, t(34) = 4.49, p < .001, d = 0.76.
Independent-Samples T-Test Example
An independent-samples t-test showed that urban participants reported significantly higher digital literacy scores (M = 29.62, SD = 5.11) than rural participants (M = 25.84, SD = 4.89), t(88) = 3.58, p = .001, d = 0.75.
Paired-Samples T-Test Example
A paired-samples t-test showed that participants’ confidence scores were significantly higher after the training (M = 31.20, SD = 3.88) than before the training (M = 27.45, SD = 4.10), t(24) = 5.09, p < .001, d = 1.02.
Each of these examples follows the same basic logic: descriptive statistics first, inferential result next, and a clear statement of direction throughout.
Example of a Polished Results Paragraph
An independent-samples t-test was conducted to examine whether attendance at the revision workshop influenced students’ statistics test scores. The results showed that students who attended the workshop scored significantly higher (M = 78.40, SD = 8.21) than students who did not attend (M = 71.15, SD = 9.03), t(58) = 3.24, p = .002, d = 0.84. This finding suggests that workshop attendance was associated with stronger academic performance in statistics.
This style works well because it reads as a complete academic finding rather than a raw numerical statement.
Quick APA Reporting Table
| Type of t-test | Reporting pattern |
|---|---|
| One-sample t-test | The mean score for [sample] was significantly [higher/lower] than [value], t(df) = x.xx, p = .xxx. |
| Independent-samples t-test | [Group 1] scored significantly [higher/lower] than [Group 2], t(df) = x.xx, p = .xxx. |
| Paired-samples t-test | Scores at [Time 2] were significantly [higher/lower] than at [Time 1], t(df) = x.xx, p = .xxx. |
These brief patterns become much stronger when the means, standard deviations, and effect size are included.
Final Thoughts
Good APA-style t-test reporting strengthens the entire results section. It turns numerical output into evidence that can be followed, understood, and evaluated. A strong result does more than announce significance. It shows what was compared, how the groups differed, and why the finding matters.
That level of clarity is especially important in dissertations, theses, assignments, and journal-style papers, where the quality of reporting affects how convincing the analysis appears. Strong analysis matters, but strong reporting is what allows the analysis to speak clearly.
FAQ: How to Report T-Test Results in APA Style
What should be included in APA t-test reporting?
A full APA-style t-test result usually includes the means, standard deviations, t statistic, degrees of freedom, p value, and the direction of the difference. Effect size is also valuable when available.
How should an independent-samples t-test be written in APA style?
It is usually written by presenting the mean and standard deviation for each group, followed by the t value, degrees of freedom, p value, and a clear statement showing which group scored higher or lower.
How should a paired-samples t-test be written in APA style?
The two related conditions or time points should be named clearly, and the result should show the mean and standard deviation at each point along with the t value, degrees of freedom, and p value.
Is it enough to report only the p value?
No. A p value alone does not show the actual pattern of the result. The means, standard deviations, and direction of the difference are also needed.
How should a non-significant t-test result be reported?
A non-significant result should still include the means, standard deviations, t value, degrees of freedom, and p value. It should read like a full finding rather than a brief dismissal.
Should p = 0.000 be written in APA style?
No. In APA style, very small values should be reported as p < .001.
Why is effect size important in t-test reporting?
Effect size helps show the magnitude of the difference. Statistical significance indicates whether a difference is unlikely to be due to chance, while effect size helps show how substantial that difference appears to be.
Can SPSS output be pasted directly into the results section?
Raw output can be included as a table or appendix where appropriate, but the main results section should still present the finding in clear academic prose.