How to Choose the Right Statistical Test for Research, Thesis, and Dissertation
Choosing the right statistical test is one of the most important decisions in academic research. The strength of the findings depends not only on the data collected, but also on whether the analytical method matches the study objective, the variables, the research design, and the assumptions required by the chosen procedure. When the wrong test is used, the interpretation becomes weaker, the results become harder to defend, and the credibility of the dissertation or thesis can be reduced.
In many projects, the difficulty is not the absence of data but uncertainty about how the data should be analyzed. Two studies may appear similar on the surface while requiring different statistical procedures. A researcher may want to compare group means, examine relationships between variables, test association between categories, predict an outcome, or measure change after an intervention. Each of these purposes requires a different analytical route. Strong statistical work begins with selecting a method that fits the actual research problem.
Selecting an appropriate statistical test requires close attention to the purpose of the study, the nature of the variables, the number of groups or conditions involved, the level of measurement, and the assumptions attached to each method. When the test is matched correctly to these elements, the analysis becomes more defensible, the results become more meaningful, and the overall quality of the research report is strengthened.
Why choosing the right statistical test matters
A statistical test is the link between a research question and a research conclusion. It determines whether the evidence in the data supports a difference, a relationship, an association, or a predictive effect. Because of this, test selection shapes the validity of the findings and the quality of the final discussion. A weak choice at this stage can affect the entire dissertation, even when the topic, literature review, and methodology are strong.
Supervisors and examiners often pay close attention to statistical choice because it shows whether the researcher understands the structure of the study. They want to see that the test was not selected simply because it is common or available in software, but because it is appropriate for the exact design of the project. A correctly chosen test supports clearer reporting, stronger interpretation, and more convincing conclusions.
A well-matched statistical procedure also makes academic writing easier. When the test fits the research question, the results chapter becomes more coherent. The tables and figures are easier to explain, the findings relate more naturally to the hypotheses, and the discussion can engage with the evidence more confidently. This is one of the reasons students frequently search for dissertation data analysis help and data analysis help when they reach the analytical stage of a major project.
Begin with the research objective
The first step in choosing a statistical test is identifying the exact aim of the analysis. Research objectives usually fall into a few broad categories. Some studies are designed to compare groups. Others are designed to assess relationships, investigate association between categories, or predict outcomes. Some are mainly descriptive and require summarizing the sample rather than testing statistical significance.
A comparative objective may ask whether male and female respondents differ in average satisfaction score, whether a training program changed performance, or whether students from different departments have different levels of stress. A relational objective may ask whether income is related to savings behaviour or whether anxiety is associated with academic performance. A predictive objective may ask whether several independent variables influence customer loyalty, purchase intention, or employee retention.
Once the objective is clear, the range of possible tests narrows substantially. A study that compares means will not normally use the same test as a study that predicts an outcome. A project examining association between categories requires a different approach from one analyzing continuous variables. The research objective is therefore the foundation of sound statistical decision-making.
Identify the dependent and independent variables
After the objective has been defined, the next step is to identify the variables and their roles in the study. In many quantitative projects, one variable serves as the outcome while one or more others act as predictors, grouping factors, or explanatory variables. The dependent variable is the main outcome being measured. The independent variable is the factor expected to influence, explain, classify, or predict that outcome.
For example, in a study examining whether gender affects exam performance, exam performance is the dependent variable and gender is the independent variable. In a study assessing whether study time predicts marks, marks are the dependent variable while study time is the independent variable. In a project exploring whether job satisfaction differs across departments, job satisfaction is the dependent variable and department is the independent variable.
Correctly identifying the role of each variable helps determine the analytical structure of the study. It prevents confusion during model building, improves interpretation, and ensures that the chosen statistical test reflects the actual logic of the research.
Determine the level of measurement
The level of measurement is one of the most important factors in statistical test selection. Variables may be nominal, ordinal, interval, or ratio. In practical research analysis, they are often treated as categorical or continuous depending on their structure and intended use.
Nominal variables represent categories without order, such as gender, marital status, region, or department. Ordinal variables involve ranked categories, such as low, medium, and high satisfaction. Interval and ratio variables are continuous and include measures such as age, income, score, blood pressure, and time.
The type of variable shapes the test choice directly. When both variables are categorical, chi-square may be appropriate. A t test or ANOVA may be considered if the study compares a continuous outcome across two or more categories. For two continuous variables examined together, correlation or regression is often more suitable. Logistic regression is usually a better option than linear regression when the dependent variable is binary.
When the level of measurement is misunderstood, the entire analysis can move in the wrong direction. A strong research chapter therefore begins by defining each variable clearly before the test is selected.
Decide whether the observations are independent or paired
The structure of the observations also affects the test choice. Some studies involve independent groups, while others involve repeated or paired observations. Independent observations come from separate participants or groups with no overlap. Paired observations come from the same participants measured twice, matched cases, or repeated observations across time.
A comparison between two separate classes or two hospitals usually involves independent data. A comparison between pre-test and post-test scores for the same participants involves paired data. These two designs cannot be treated in the same way because the statistical assumptions are different.
For example, an independent samples t test is used for two separate groups, while a paired samples t test is used for before-and-after measurements on the same respondents. Treating paired data as if they were independent weakens the analysis and may lead to inaccurate results. A clear understanding of the design helps prevent this type of error.
Consider the number of groups or conditions
The number of groups being compared is another major factor. A study may compare two groups, three groups, or several categories. The correct test depends on how many distinct conditions are involved and whether the data are independent or repeated.
When a continuous outcome is compared across two independent groups, the independent samples t test may be suitable if assumptions are met. When the same continuous outcome is compared across three or more groups, ANOVA is generally more appropriate than conducting multiple separate t tests. Running many t tests for the same objective increases the chance of false positives and weakens statistical rigor.
Where the assumptions for parametric testing are not satisfied, nonparametric alternatives may be considered. Mann–Whitney U may be used instead of the independent t test, while Kruskal–Wallis may be used instead of one-way ANOVA. These decisions should be based on the properties of the data rather than convenience.
Match the purpose to comparison, association, or prediction
A useful way to organize statistical choices is to classify the purpose of the analysis as comparison, association, or prediction. This framework helps reduce confusion and makes it easier to connect research questions to appropriate procedures.
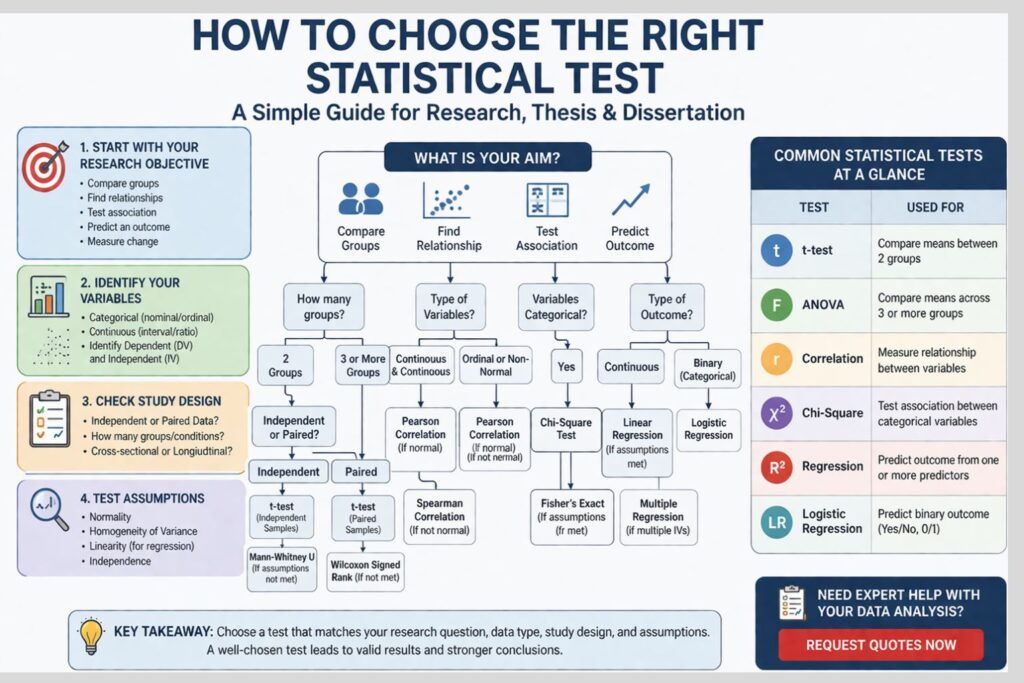
Comparison focuses on whether there are significant differences between groups or conditions. Common tests include the t test, paired t test, ANOVA, repeated measures ANOVA, and nonparametric alternatives. Association focuses on whether variables are related or whether categories are linked. Common tests include Pearson correlation, Spearman correlation, and chi-square. Prediction focuses on whether one or more variables explain or influence an outcome. Common procedures include linear regression, multiple regression, and logistic regression depending on the dependent variable.
Once the purpose is clear, test selection becomes more logical. The remaining steps involve checking whether the variable types, number of groups, and assumptions support the method under consideration.
Common statistical tests and when they are used
Some statistical tests appear repeatedly in theses, dissertations, and journal-based academic work. Understanding their purpose helps reduce misapplication and improves reporting quality.
The independent samples t test is used to compare the mean of a continuous variable across two independent groups. The paired samples t test is used when the same participants are measured twice. One-way ANOVA is used when a continuous outcome is compared across three or more independent groups. Repeated measures ANOVA is used for repeated observations across several conditions or time points.
Pearson correlation is used to examine the relationship between two continuous variables when assumptions are met. Spearman correlation is used for ordinal variables or non-normally distributed data. Chi-square is used when the aim is to test association between categorical variables. Linear regression is used to predict a continuous outcome from one or more predictors. Logistic regression is used when the outcome variable is binary, such as yes or no, employed or unemployed, success or failure.
Each of these tests has a specific purpose. They are not interchangeable, and strong research depends on selecting the one that fits the study for the right reason.
Check assumptions before finalizing the test
A test may appear suitable based on the objective and variable types, but assumptions must still be examined before the decision is finalized. Assumption checking is an important part of statistical quality because many parametric procedures rely on conditions that affect whether the results can be trusted.
Common assumptions include normality, independence of observations, homogeneity of variance, linearity, absence of multicollinearity, and homoscedasticity depending on the chosen method. If these assumptions are violated, the researcher may need to transform the data, reconsider the model, or choose a nonparametric alternative.
For example, Pearson correlation may need to be replaced by Spearman correlation when the data are ordinal or strongly non-normal. An independent samples t test may be replaced by Mann–Whitney U when the distribution is unsuitable for parametric comparison. Regression models also require attention to error structure, outliers, and predictor overlap.
A strong dissertation does not simply present the final test. It also explains why the method remained appropriate after diagnostic checks. This adds credibility and strengthens academic defense.
Choosing tests for categorical variables
Categorical variables are common in social science, business, education, healthcare, and public policy research. They often represent groups, classifications, statuses, or responses with limited categories. Because of this, they must be analyzed with methods designed for categories rather than with procedures intended for continuous data.
When both variables are categorical, chi-square is commonly used to examine whether a statistically significant association exists between them. For instance, a researcher may test whether smoking status is associated with gender, whether voting preference differs by age category, or whether program participation is related to location.
However, chi-square has its own assumptions, especially regarding expected cell frequencies. If those assumptions are not met, Fisher’s exact test or other alternatives may be more appropriate. The important point is that the structure of categorical data should determine the method from the beginning.
Choosing tests for continuous variables
Continuous data allow broader analytical options, but they also require more careful distinctions. When a continuous outcome is compared across categories, group-comparison methods such as t tests or ANOVA may be suitable. Correlation is often appropriate when the goal is to examine the association between two continuous variables. For studies estimating how one or more variables influence a continuous outcome, regression is usually the better choice.
A study exploring the link between hours of study and exam score may use correlation or regression depending on the phrasing of the research objective. A project comparing stress score across year groups may use ANOVA. A dissertation testing whether age, income, and education predict investment behaviour may use multiple regression.
The same variable can therefore appear in different analytical roles depending on the study objective. That is why statistical choice should always be driven by the question, not by the variable alone.
How hypotheses guide statistical test selection
Hypotheses often provide a direct path toward the correct analytical procedure. A hypothesis that predicts a significant difference between groups typically points toward comparative tests. When the focus is on a significant relationship, correlation or association analysis is often more appropriate. If the study examines the influence of one or more independent variables on an outcome, regression-based analysis is usually the better choice.
For example, a hypothesis stating that there is a significant difference in job satisfaction between public and private sector employees suggests a two-group comparison. A hypothesis stating that there is a significant relationship between social media use and academic performance suggests relational testing. A hypothesis stating that service quality, trust, and price significantly influence customer loyalty suggests a regression framework.
When hypotheses are clearly formulated, they help align theory, method, and interpretation. This improves both the technical and writing quality of the research project.
Parametric and nonparametric tests
A common issue in dissertation analysis is deciding whether a parametric or nonparametric test should be used. Parametric tests are generally more powerful when their assumptions are satisfied and when the data are continuous and reasonably well-behaved. Nonparametric tests are valuable when data are ordinal, when sample sizes are small, or when the assumptions for parametric procedures are clearly violated.
This distinction should not be approached as a matter of difficulty or software familiarity. A nonparametric test is not chosen because it is easier, and a parametric test is not chosen merely because it is common. The selection should reflect the structure of the data and the assumptions required by the method.
A strong dissertation justifies this choice explicitly. Doing so strengthens the results chapter and shows methodological maturity.
Examples of test selection in real research
A student in education may want to know whether three teaching methods produce different average mathematics scores. The dependent variable is continuous, while the independent variable has three groups. If assumptions are met, one-way ANOVA may be the correct choice.
A business student may want to determine whether customer trust predicts customer loyalty. If both constructs are measured as continuous scale scores and the assumptions are satisfied, linear regression may be suitable. If additional predictors such as price perception and service quality are included, multiple regression may be more appropriate.
A healthcare study may ask whether smoking status is associated with hypertension diagnosis. Because both variables are categorical, chi-square may be suitable. A psychology study measuring anxiety before and after treatment among the same participants may require a paired samples t test if assumptions hold.
These examples show that the correct test depends on the research design, variable structure, and study objective rather than on discipline alone.
Common mistakes when selecting a statistical test
One of the most common mistakes is choosing a test because it is familiar rather than because it is appropriate. Students may apply correlation when the real objective is group comparison, or use several t tests where one ANOVA would be statistically stronger. Another frequent problem is ignoring assumptions and reporting output without first checking whether the data satisfy the conditions required by the test.
Some researchers also confuse statistical association with causation. A significant relationship does not automatically imply that one variable causes the other. Others shift inconsistently between treating Likert-scale data as ordinal and as continuous without explaining their reasoning. Another weakness is using multiple different tests for the same objective without a clear analytical purpose.
These mistakes can create serious problems in the results chapter and reduce the defensibility of the research. Careful statistical selection prevents those issues and produces more coherent findings.
How to justify the chosen test in a dissertation
Selecting the right method is only part of the work. The researcher must also justify the decision clearly in the methodology and results chapters. A strong justification explains the research objective, the variable types, the number of groups or conditions, the assumptions assessed, and the reason the chosen test was appropriate.
For example, an independent samples t test may be justified by stating that the study compared the mean of a continuous outcome across two independent groups and that the assumptions of normality and homogeneity of variance were satisfied. A regression model may be justified by explaining that the purpose of the analysis was to assess whether one or more predictors significantly influenced a continuous outcome.
These details help the reader understand the logic of the analysis and demonstrate that the findings rest on a method that is both statistically and academically defensible.
Final thoughts
Choosing the right statistical test is a critical part of research quality. The decision should be based on the research objective, the role of variables, the level of measurement, the number of groups, the structure of observations, and the assumptions required by each method. When those elements are aligned correctly, the analysis becomes stronger, the reporting becomes clearer, and the final conclusions become easier to justify.
A well-selected test improves more than the numbers on the page. It improves the logic of the dissertation, the structure of the findings chapter, the clarity of the interpretation, and the confidence with which the research can be defended. That is why careful test selection remains one of the most valuable steps in serious academic work.
Frequently Asked Questions
How do I choose the right statistical test for my research?
The correct statistical test depends on the research objective, variable types, number of groups, study design, and assumptions required by the method.
What is the first thing to check before choosing a test?
The first thing to check is the research question or hypothesis. The analysis should match what the study is trying to determine.
Does variable type affect the choice of statistical test?
Yes. Categorical, ordinal, and continuous variables require different analytical methods, and the level of measurement strongly influences the test selected.
When should I use a t test?
A t test is commonly used when comparing the mean of a continuous variable across two groups. The exact form depends on whether the groups are independent or paired.
When should I use ANOVA instead of a t test?
ANOVA is generally more appropriate when a continuous outcome is being compared across three or more groups.
What is the difference between correlation and regression?
Correlation measures the strength and direction of association between variables, while regression estimates predictive influence and models the effect of one or more predictors on an outcome.
When is chi-square used?
Chi-square is used when the variables are categorical and the aim is to test whether there is an association between them.
What if my data are not normally distributed?
If parametric assumptions are violated, nonparametric alternatives such as Mann–Whitney U, Kruskal–Wallis, or Spearman correlation may be more appropriate depending on the design.
Can one dissertation use more than one statistical test?
Yes. A dissertation may use multiple tests if different research questions or hypotheses require different forms of analysis. Each test should have a clear purpose and proper justification.