Difference Between Logistic and Linear Regression: Complete Student Guide
Many students struggle to understand the difference between logistic and linear regression because both methods use independent variables to explain or predict an outcome. These methods are both regression techniques, and each can include continuous, categorical, or binary predictors. Researchers use them in dissertation data analysis, business analytics, healthcare research, psychology, education, economics, public health, and social science research.
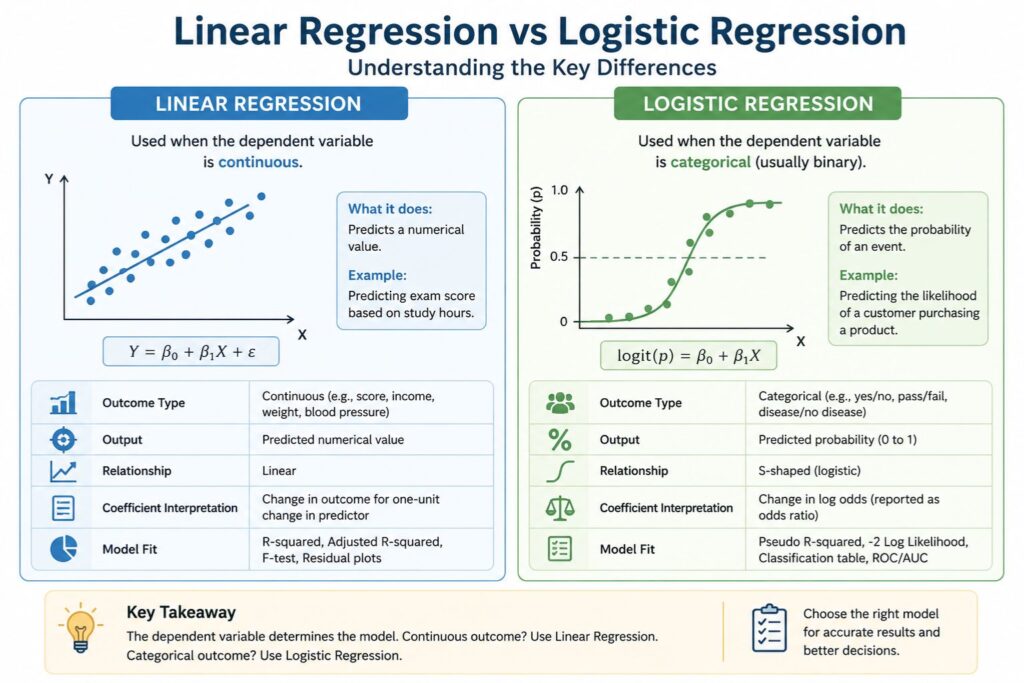
The main difference is the type of dependent variable. Linear regression is used when the dependent variable is continuous, such as exam score, income, blood pressure, sales revenue, satisfaction score, weight, or test performance. Logistic regression is used when the dependent variable is categorical, especially binary, such as yes/no, pass/fail, disease/no disease, purchased/not purchased, admitted/not admitted, or retained/not retained.
This difference affects the model equation, predicted output, coefficient interpretation, assumptions, model fit measures, and reporting style. Linear regression predicts a numerical value. Logistic regression predicts the probability or odds that an event will occur.
Students often choose the wrong regression model because they focus on the independent variables instead of the dependent variable. That mistake can weaken the methodology chapter, produce misleading results, and create problems in the dissertation results chapter.
Need help choosing the right regression model for your research? Our statistical analysis experts can review your variables, research questions, hypotheses, and dataset before you run your analysis. You can also request professional statistical analysis support if you need help with regression model selection, data coding, assumption testing, results interpretation, or APA-style reporting.
What Is Linear Regression?
Linear regression is a statistical method used to examine the relationship between one or more independent variables and a continuous dependent variable. A continuous dependent variable is measured numerically and can take many possible values, such as income, exam score, blood pressure, sales revenue, weight, height, age, satisfaction score, or stress score.
Linear regression predicts numerical outcomes. For example, a student may use linear regression to predict exam scores from study hours, sales revenue from advertising spend, blood pressure from age and body mass index, or job satisfaction score from workload and salary.
There are two common types of linear regression. Simple linear regression uses one independent variable to predict one continuous dependent variable. Multiple linear regression uses two or more independent variables to predict one continuous dependent variable.
For example, simple linear regression may examine whether study hours predict exam score. Multiple linear regression may examine whether study hours, class attendance, and prior GPA predict exam score.
Linear regression is common in dissertations and research papers because many academic studies examine continuous outcomes. A healthcare study may predict systolic blood pressure. A business study may predict monthly sales. An education study may predict student performance. A psychology study may predict stress score. An economics study may predict income.
A basic linear regression model can be written as:
Y = β0 + β1X + ε
In this model, Y is the dependent variable, X is the independent variable, β0 is the intercept, β1 is the regression coefficient, and ε is the error term. In simple terms, the model estimates the expected value of the outcome based on the predictor.
The most important rule is simple: use linear regression when your outcome variable is continuous and your research question asks whether one or more predictors explain or predict that numerical outcome.
What Is Logistic Regression?
Logistic regression is a statistical method used when the dependent variable is categorical, especially binary. A binary dependent variable has two categories, such as yes/no, pass/fail, survived/did not survive, disease/no disease, purchased/not purchased, employed/unemployed, or readmitted/not readmitted.
Unlike linear regression, logistic regression does not predict a normal numerical value. It predicts the probability that an event occurs. For example, logistic regression may estimate the probability that a patient is readmitted to hospital, a student passes an exam, a customer buys a product, or an employee leaves an organization.
Binary logistic regression is the most common type. It is used when the outcome has two categories. However, logistic regression also has other forms. Ordinal logistic regression is used when the outcome categories have a natural order, such as low, moderate, and high risk. Multinomial logistic regression is used when the outcome has more than two unordered categories, such as product type A, product type B, and product type C.
Logistic regression is common in healthcare, public health, business analytics, education, psychology, political science, social science, and classification problems. It is useful when the researcher wants to understand whether predictors increase or decrease the likelihood of an event.
A simple logistic regression model can be written as:
logit(p) = β0 + β1X
Here, p is the probability of the event occurring. Logistic regression models the log odds of the outcome, which can be converted into odds ratios. Odds ratios are usually easier to interpret than raw log-odds coefficients.
For example, a logistic regression model may examine whether smoking status predicts disease status. If the odds ratio for smoking is greater than 1, smoking is associated with higher odds of the disease, holding other variables constant.
The most important rule is this: use logistic regression when your outcome variable is categorical, especially binary, and your research question asks whether predictors increase or decrease the probability or odds of an event.
Difference Between Logistic and Linear Regression: Quick Comparison Table
| Feature | Linear Regression | Logistic Regression |
|---|---|---|
| Main purpose | Predicts a continuous outcome | Predicts probability of a categorical outcome |
| Dependent variable | Continuous | Usually binary, sometimes categorical |
| Example outcome | Test score, income, weight, satisfaction score | Pass/fail, yes/no, disease/no disease |
| Output type | Predicted numerical value | Predicted probability |
| Model relationship | Linear relationship | S-shaped logistic relationship |
| Coefficient meaning | Change in outcome for one-unit change in predictor | Change in log odds; often reported as odds ratio |
| Common interpretation | “Y increases by…” | “Odds increase/decrease by…” |
| Error distribution | Often assumes normally distributed residuals | Uses a binomial structure for binary outcomes |
| Typical model fit | R-squared, adjusted R-squared, residual plots | -2 Log Likelihood, pseudo R-squared, classification table, ROC/AUC |
| Common use | Prediction of numerical values | Classification and probability prediction |
| Example method | Simple or multiple linear regression | Binary, ordinal, or multinomial logistic regression |
The dependent variable is the most important difference. If the outcome is continuous, linear regression may be appropriate. If the outcome is binary or categorical, logistic regression may be appropriate.
Independent variables do not determine the model by themselves. Both linear and logistic regression can use continuous predictors, categorical predictors, and binary predictors. The outcome variable drives the model choice.
The Most Important Difference: Type of Dependent Variable
The easiest way to choose between linear regression and logistic regression is to identify the dependent variable. The dependent variable is also called the outcome variable. It is the variable the study is trying to explain, predict, or model.
Use linear regression when the dependent variable is continuous.
Use logistic regression when the dependent variable is categorical, especially binary.
| Research Question | Dependent Variable | Correct Model |
|---|---|---|
| Does study time predict exam score? | Exam score, continuous | Linear regression |
| Does age predict disease status? | Disease/no disease, binary | Logistic regression |
| Does advertising spend predict monthly revenue? | Revenue, continuous | Linear regression |
| Does income predict customer purchase? | Purchased/not purchased, binary | Logistic regression |
| Do workload and salary predict job satisfaction score? | Satisfaction score, continuous | Linear regression |
| Do age, sex, and BMI predict hospital readmission? | Readmitted/not readmitted, binary | Logistic regression |
| Does training predict employee productivity score? | Productivity score, continuous | Linear regression |
| Does customer satisfaction predict subscription cancellation? | Cancelled/not cancelled, binary | Logistic regression |
This distinction matters because using the wrong regression model can produce invalid or misleading findings. If you use linear regression for a yes/no outcome, the model may predict impossible values below 0 or above 1. It may also violate important model assumptions because the outcome is not continuous.
If you use logistic regression for a continuous outcome such as income or exam score, you lose important numerical information and use the wrong model structure.
A simple rule is helpful: look at the dependent variable first, then choose the regression model.
How Linear and Logistic Regression Models Work
Although linear and logistic regression both estimate relationships between predictors and an outcome, they do not model the outcome in the same way.
Linear regression fits a straight-line relationship between the predictors and a continuous dependent variable. The model estimates the expected value of the outcome. For example, it may predict exam score from study hours or sales revenue from advertising spend.
The linear regression equation is:
Y = β0 + β1X + ε
This means the predicted value of Y is based on the intercept, the coefficient for X, and an error term. If the coefficient is positive, the outcome increases as the predictor increases. If the coefficient is negative, the outcome decreases as the predictor increases.
Logistic regression works differently. It models the probability of an event occurring. Because probabilities must stay between 0 and 1, logistic regression uses a logistic function. This creates an S-shaped curve rather than a straight line.
The logistic regression equation is:
logit(p) = β0 + β1X
This means the model estimates the log odds of the outcome. Because log odds are not easy for most students to understand, logistic regression results are often interpreted using odds ratios.
For example, if a logistic regression model predicts whether a student passes or fails, it does not predict an exam score. It predicts the probability of passing. If that probability is high enough, the student may be classified as likely to pass.
The practical difference is simple: linear regression predicts how much of a continuous outcome is expected, while logistic regression predicts how likely an event is to happen.
When Should You Use Linear Regression?
Use linear regression when your dependent variable is continuous and your research question asks whether one or more predictors explain or predict that outcome.
Linear regression is useful when you want to estimate the direction, strength, and size of a relationship between predictors and a numerical outcome. It helps answer questions such as: Does X predict Y? How much does Y change when X increases? Which predictors significantly explain variation in Y?
| Field | Linear Regression Example |
|---|---|
| Education | Predicting exam scores from study hours and attendance |
| Healthcare | Predicting systolic blood pressure from age, BMI, and activity level |
| Business | Predicting sales revenue from advertising spend and product price |
| Psychology | Predicting stress score from workload and sleep quality |
| Economics | Predicting income from education and years of experience |
| Public health | Predicting health knowledge score from training exposure |
| Social science | Predicting civic engagement score from education and media use |
Linear regression can be simple or multiple. Simple linear regression includes one predictor. Multiple linear regression includes two or more predictors.
For example, if you want to know whether study hours predict exam score, simple linear regression may be enough. If you want to know whether study hours, attendance, and prior GPA predict exam score, multiple linear regression is more appropriate.
Linear regression is widely used in dissertations, theses, journal articles, business reports, and applied research projects because many outcomes are measured on continuous scales.
When Should You Use Logistic Regression?
Use logistic regression when your dependent variable is categorical, especially when it has two categories. Logistic regression is appropriate when your research question asks whether predictors increase or decrease the probability or odds of an event.
Binary logistic regression is used for outcomes such as:
- Yes/no
- Pass/fail
- Disease/no disease
- Purchased/not purchased
- Readmitted/not readmitted
- Retained/not retained
- Supported/opposed
- Completed/not completed
| Field | Logistic Regression Example |
|---|---|
| Healthcare | Predicting whether a patient has a disease |
| Public health | Predicting whether a person accepts vaccination |
| Business | Predicting whether a customer buys a product |
| Education | Predicting whether a student passes or fails |
| Human resources | Predicting whether an employee leaves an organization |
| Social science | Predicting whether a respondent supports a policy |
| Marketing | Predicting whether a lead converts into a customer |
Logistic regression is helpful because it estimates probability. For example, it may estimate the probability that a customer purchases a product based on age, income, browsing time, and previous purchase history.
There are different types of logistic regression. Binary logistic regression is used for two-category outcomes. Ordinal logistic regression is used for ordered categorical outcomes, such as low, medium, and high satisfaction. Multinomial logistic regression is used for unordered categorical outcomes with more than two categories.
Logistic regression is often used for classification, but it is not only a classification tool. It also helps researchers understand how predictors affect the odds or probability of an outcome.
Coefficients, Odds Ratios, and Interpretation
One of the biggest differences between linear and logistic regression is how coefficients are interpreted.
In linear regression, the coefficient tells you how much the dependent variable changes for a one-unit increase in the predictor, holding other predictors constant.
For example, suppose study hours has a coefficient of 3.2 in a linear regression model predicting exam score. This means each additional study hour is associated with a 3.2-point increase in exam score, holding other predictors constant.
A positive coefficient means the outcome increases as the predictor increases. A negative coefficient means the outcome decreases as the predictor increases. The p-value tells whether the relationship is statistically significant, while the confidence interval shows the precision of the estimate.
In logistic regression, coefficients are expressed in log odds, which are difficult for many students to interpret directly. For that reason, logistic regression results are often reported as odds ratios.
An odds ratio above 1 shows that the odds of the outcome increase. Values below 1 show lower odds of the outcome. When the odds ratio equals 1, the predictor does not change the odds.
For example, suppose the odds ratio for smoking is 2.0 in a logistic regression model predicting disease status. This means smokers have twice the odds of the disease compared with non-smokers, holding other predictors constant.
Suppose the odds ratio for an intervention is 0.60 in a model predicting hospital readmission. This means the intervention is associated with lower odds of readmission, holding other predictors constant.
Students must remember that odds are not the same as probability. Probability describes how likely an event is out of all possible outcomes. Odds compare the chance of the event occurring to the chance of it not occurring. This distinction matters when writing accurate results.
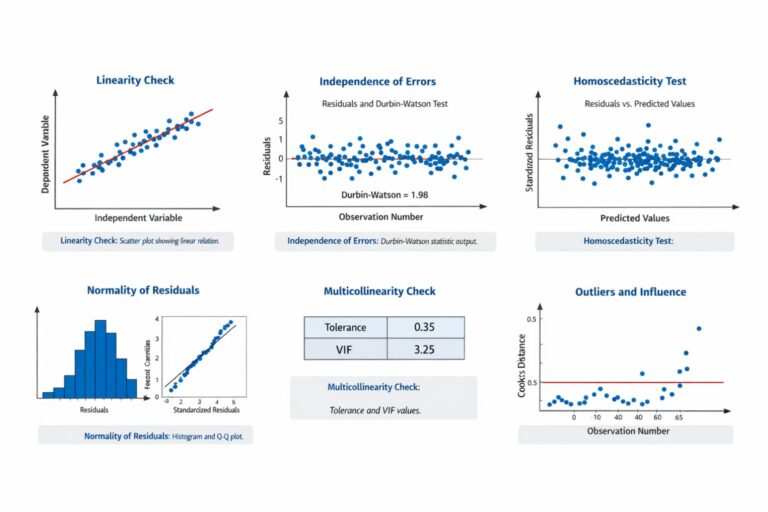
Assumptions of Linear Regression
Linear regression has assumptions that should be checked before interpreting results. These assumptions help determine whether the model is appropriate and whether the results are reliable.
| Assumption | Meaning | Common Check |
|---|---|---|
| Linearity | Predictors relate linearly to the outcome | Scatterplots, residual plots |
| Independence | Observations are independent | Study design, Durbin-Watson for some data |
| Homoscedasticity | Residual spread is roughly constant | Residual plot |
| Normality of residuals | Errors are approximately normal | Histogram, Q-Q plot |
| No severe multicollinearity | Predictors are not too highly related | VIF, tolerance |
| No extreme influential outliers | Extreme cases do not distort the model | Cook’s distance, leverage |
Linearity means the relationship between predictors and the outcome should be approximately linear. If the relationship is curved, a simple linear model may not fit well.
Independence means one observation should not depend on another. If the same person appears multiple times in the dataset, a basic linear regression may not be appropriate without adjustment.
Homoscedasticity means the residuals should have a roughly constant spread across predicted values. If the residuals spread out widely at higher predicted values, the model may have heteroscedasticity.
Normality of residuals means the errors should be approximately normally distributed. This is especially important for inference, such as confidence intervals and p-values.
Multicollinearity occurs when predictors are too highly related to each other. This can make coefficients unstable and difficult to interpret.
Influential outliers can distort the regression line. Students should check whether extreme cases are affecting the model too strongly.
Assumptions of Logistic Regression
Logistic regression has different assumptions from linear regression. It does not require normally distributed residuals in the same way linear regression does, but it still requires careful checking.
| Assumption | Meaning | Common Check |
|---|---|---|
| Correct outcome type | Outcome is categorical, often binary | Variable coding |
| Independence | Observations are independent | Study design |
| Linearity in the logit | Continuous predictors relate linearly to log odds | Box-Tidwell or diagnostic checks |
| No severe multicollinearity | Predictors are not too highly correlated | VIF, tolerance |
| Adequate sample size | Enough events and non-events | Events per variable |
| No extreme influential cases | No cases dominate the model | Residuals, leverage, influence diagnostics |
The outcome variable must be coded correctly. For binary logistic regression, the dependent variable should have two categories, often coded as 0 and 1.
Independence of observations is still important. If the data involve repeated measures, clustered observations, or nested data, a different modeling approach may be required.
Linearity in the logit means continuous predictors should have a linear relationship with the log odds of the outcome, not necessarily with the outcome itself.
Multicollinearity can also affect logistic regression. If predictors are too highly correlated, the model may produce unstable estimates.
Adequate sample size is especially important. Logistic regression needs enough events and non-events to estimate the model reliably. A model predicting a rare outcome may require more data or fewer predictors.
Influential cases can affect logistic regression estimates, so students should check whether any cases dominate the model.
Model Fit: R-Squared vs Pseudo R-Squared
Model fit is interpreted differently in linear regression and logistic regression.
In linear regression, R-squared tells how much variance in the continuous dependent variable is explained by the predictors. For example, an R-squared of 0.40 means the model explains 40% of the variance in the outcome.
Adjusted R-squared is often used when comparing models with different numbers of predictors. It adjusts for the number of predictors and gives a more conservative estimate of explanatory power.
Linear regression model fit may also be evaluated using residual plots, F-tests, standard error of estimate, and comparison of predicted and observed values.
Logistic regression does not use ordinary R-squared in the same way. Instead, it may use pseudo R-squared measures, such as Cox and Snell R-squared or Nagelkerke R-squared. These values can be useful, but students should not interpret them exactly like ordinary R-squared.
Logistic regression model fit may also be evaluated using:
- -2 Log Likelihood
- Likelihood ratio test
- Hosmer-Lemeshow test
- Classification table
- Sensitivity
- Specificity
- ROC curve
- AUC
For dissertation reporting, this means students must be careful. A linear regression results section may focus on R-squared, adjusted R-squared, F-test, coefficients, and residual checks. A logistic regression results section may focus on model fit statistics, odds ratios, confidence intervals, classification accuracy, and ROC/AUC when relevant.
Linear Regression vs Logistic Regression for Dissertation Data Analysis
Many dissertation students choose the wrong model because they focus on the independent variables instead of the dependent variable. This is one of the most common regression mistakes.
Predictors can be continuous or categorical in both models. For example, age, gender, income, treatment group, education level, and satisfaction category can appear as predictors in either linear or logistic regression if they are coded properly.
The dependent variable drives the model choice. A continuous outcome usually points to linear regression. A binary outcome usually points to logistic regression.
| Dissertation Topic Type | Possible Outcome | Better Model |
|---|---|---|
| Student performance study | Final exam score | Linear regression |
| Hospital readmission study | Readmitted/not readmitted | Logistic regression |
| Employee satisfaction study | Satisfaction score | Linear regression |
| Employee turnover study | Stayed/left | Logistic regression |
| Customer behavior study | Amount spent | Linear regression |
| Customer conversion study | Purchased/not purchased | Logistic regression |
| Public health awareness study | Knowledge score | Linear regression |
| Public health screening study | Screened/not screened | Logistic regression |
For example, if a dissertation examines whether study hours, attendance, and age predict final exam score, linear regression is appropriate because the outcome is a continuous score.
If another dissertation examines whether age, income, and awareness predict whether someone accepts vaccination, logistic regression is appropriate because the outcome is binary.
If you are unsure whether your dissertation requires linear regression, logistic regression, ordinal regression, or another model, our statistical analysis experts can review your research questions and dataset before you run the wrong analysis.
Field-Based Examples: Linear Regression or Logistic Regression?
The best way to choose between linear and logistic regression is to match the model to the outcome variable. The field does not decide the model. The dependent variable does.
| Field | Research Aim | Outcome Variable | Best Model |
|---|---|---|---|
| Education | Predict academic performance | Final grade or exam score | Linear regression |
| Education | Predict pass/fail status | Passed or failed | Logistic regression |
| Healthcare | Predict blood pressure | Systolic blood pressure | Linear regression |
| Healthcare | Predict diagnosis status | Disease or no disease | Logistic regression |
| Business | Predict customer spending | Amount spent | Linear regression |
| Business | Predict purchase decision | Purchased or did not purchase | Logistic regression |
| Psychology | Predict anxiety level | Anxiety scale score | Linear regression |
| Psychology | Predict risk category | At risk or not at risk | Logistic regression |
| Public health | Predict knowledge level | Knowledge score | Linear regression |
| Public health | Predict screening uptake | Screened or not screened | Logistic regression |
| Human resources | Predict job satisfaction | Satisfaction score | Linear regression |
| Human resources | Predict employee turnover | Stayed or left | Logistic regression |
This table shows why two studies in the same field can require different models. A healthcare study predicting blood pressure may use linear regression. A healthcare study predicting disease status may use logistic regression. A business study predicting amount spent may use linear regression. A business study predicting whether a customer buys may use logistic regression.
Common Mistakes Students Make
Students often make regression errors because they choose the model too quickly or misunderstand the dependent variable.
| Mistake | Why It Is a Problem |
|---|---|
| Choosing the model based on predictor type | The dependent variable determines the model |
| Using linear regression for yes/no outcomes | Predicted values may be invalid |
| Using logistic regression for continuous outcomes | The model does not fit the outcome scale |
| Treating Likert items incorrectly | Measurement level may be misclassified |
| Ignoring assumptions | Results may be unreliable |
| Misinterpreting odds ratios as probabilities | Interpretation becomes inaccurate |
| Reporting p-values only | Practical meaning is missing |
| Ignoring confidence intervals | Precision is not shown |
| Ignoring multicollinearity | Coefficients may be unstable |
| Not checking outliers or influential cases | Model estimates may be distorted |
| Reporting model fit incorrectly | Results may mislead readers |
| Copying raw output into Chapter 4 | The results section may look unprofessional |
| Failing to connect results to research questions | The analysis may not answer the study aim |
These mistakes can weaken a dissertation results chapter and lead to supervisor revisions. A correct regression model should match the research question, the outcome variable, the data structure, and the assumptions of the method.
How to Report Linear and Logistic Regression Results
Reporting regression results requires more than saying whether the model was significant. A strong results section should explain the purpose of the model, identify the dependent and independent variables, report model fit, interpret key coefficients, and connect the findings to the research questions.
For linear regression, report:
- The purpose of the model
- The dependent variable
- The independent variables
- R-squared and adjusted R-squared
- F-test for overall model significance
- Regression coefficients
- Standard errors
- p-values
- Confidence intervals
- Assumption checks where relevant
- Interpretation in relation to the research question
A student-friendly linear regression reporting sentence may look like this:
“The regression model examined whether study hours predicted exam score. The coefficient for study hours was positive, indicating that higher study time was associated with higher exam scores, holding other variables constant.”
For logistic regression, report:
- The purpose of the model
- The outcome coding
- The independent variables
- Model fit statistics
- Odds ratios
- Confidence intervals
- p-values
- Classification table or ROC/AUC where relevant
- Interpretation in terms of odds or probability
- Connection to the hypothesis
A student-friendly logistic regression reporting sentence may look like this:
“The logistic regression model examined whether age and prior purchase history predicted customer purchase status. The odds ratio for prior purchase history was above 1, indicating higher odds of purchase among customers with previous purchases, holding other predictors constant.”
Avoid reporting raw output without explanation. A dissertation results section should translate statistical output into clear academic interpretation.
Which Regression Model Should You Choose?
Use the dependent variable as your first decision point.
Before you choose a regression model, ask these questions:
| Question | Why It Matters |
|---|---|
| Is the dependent variable continuous? | A continuous outcome usually points to linear regression |
| Is the dependent variable binary? | A yes/no outcome usually points to binary logistic regression |
| Is the outcome ordered? | Ordered categories may require ordinal logistic regression |
| Is the outcome unordered with 3+ categories? | Multinomial logistic regression may be needed |
| Are predictors continuous, categorical, or mixed? | Predictors must be coded correctly |
| Is the sample size adequate? | Weak sample size can affect model stability |
| Are assumptions reasonably met? | Violated assumptions can weaken findings |
| Does the supervisor require a specific model? | Dissertation expectations matter |
| Your Outcome Variable | Recommended Model |
|---|---|
| Continuous score | Linear regression |
| Amount of money | Linear regression |
| Weight, height, blood pressure | Linear regression |
| Satisfaction scale score | Linear regression |
| Test score | Linear regression |
| Yes/no outcome | Binary logistic regression |
| Pass/fail outcome | Binary logistic regression |
| Disease/no disease | Binary logistic regression |
| Purchased/not purchased | Binary logistic regression |
| Ordered categories | Ordinal logistic regression |
| Unordered categories with 3+ groups | Multinomial logistic regression |
This table provides a starting point, not a final decision for every project. Model choice should also consider study design, sample size, assumptions, data quality, supervisor expectations, and whether the outcome variable has been coded correctly.
For example, a satisfaction score created by summing several Likert-scale items may sometimes be treated as continuous and analyzed with linear regression. A single ordered Likert item may require another approach, such as ordinal logistic regression, depending on the research design and supervisor expectations.
When in doubt, do not force a model because it is familiar. Choose the regression method that fits the outcome variable and research question.
Do You Need Help With Regression Analysis?
You may need regression analysis help if you are unsure whether to use linear regression, logistic regression, ordinal regression, multinomial logistic regression, or another model. You may also need help if your supervisor has asked for revisions and you do not know how to correct the analysis.
Regression errors can affect the entire results chapter. Using the wrong model can produce misleading conclusions. Ignoring assumptions can weaken the credibility of the findings. Misinterpreting odds ratios can make the results inaccurate. Poor APA reporting can make a correct analysis look weak or unfinished.
At StatisticalAnalysisHelp.com, students and researchers can request support with model selection, data cleaning, variable coding, assumption testing, regression output interpretation, APA-style tables, and dissertation results writing.
Our statistical analysis support can help with:
- Choosing between linear and logistic regression
- Reviewing research questions and hypotheses
- Identifying dependent and independent variables
- Checking variable measurement levels
- Cleaning and coding data
- Testing regression assumptions
- Running regression analysis in SPSS, Stata, R, Excel, Python, or other software
- Interpreting coefficients, p-values, odds ratios, and confidence intervals
- Creating APA-style regression tables
- Writing dissertation results chapters
- Revising analysis after supervisor feedback
Request Regression Analysis Help
FAQs About the Difference Between Logistic and Linear Regression
What is the main difference between logistic and linear regression?
The main difference is the type of dependent variable. Linear regression predicts a continuous outcome, while logistic regression predicts the probability of a categorical outcome, usually a binary outcome.
When should I use linear regression?
Use linear regression when the dependent variable is continuous and the goal is to predict or explain numerical values such as scores, income, sales revenue, blood pressure, or satisfaction scale scores.
When should I use logistic regression?
Use logistic regression when the dependent variable is categorical, especially binary, such as yes/no, pass/fail, disease/no disease, purchased/not purchased, or readmitted/not readmitted.
Can independent variables be categorical in linear regression?
Yes. Categorical predictors can be used in linear regression if they are properly coded, often using dummy variables or indicator variables.
Can logistic regression use continuous predictors?
Yes. Logistic regression can include continuous, categorical, and binary predictors. For example, age, income, gender, treatment group, and prior behavior can all be used as predictors if coded correctly.
Is logistic regression only for classification?
No. Logistic regression is often used for classification, but it also explains how predictors affect the odds or probability of an outcome.
What does an odds ratio mean?
An odds ratio shows how the odds of an outcome change when a predictor increases or when one group is compared with another. An odds ratio above 1 means higher odds, below 1 means lower odds, and equal to 1 means no change in odds.
Is R-squared used in logistic regression?
Logistic regression uses pseudo R-squared measures, but they should not be interpreted exactly like ordinary R-squared in linear regression.
Can I use linear regression for a yes/no outcome?
Generally, no. A yes/no outcome usually requires binary logistic regression because linear regression can produce invalid predicted values and violate model assumptions.
Which regression is better for dissertation data analysis?
Neither model is automatically better. Linear regression is better for continuous outcomes, while logistic regression is better for binary or categorical outcomes.
Do I need a statistician for regression analysis?
You may need a statistician if you are unsure about model choice, assumptions, variable coding, interpretation, APA reporting, or dissertation results writing.
Conclusion
The difference between logistic and linear regression comes down mainly to the dependent variable. Linear regression is used when the outcome is continuous and the goal is to predict a numerical value. Logistic regression is used when the outcome is categorical, especially binary, and the goal is to predict the probability or odds of an event.
Linear regression answers questions such as, “How much does the outcome change?” Logistic regression answers questions such as, “How likely is the event to occur?” Both methods are useful, but they must be matched correctly to the research question and data type.
For dissertation students and researchers, the safest approach is to identify the dependent variable first, check the measurement level, review the research question, and then choose the regression model. A continuous outcome usually requires linear regression. A binary outcome usually requires logistic regression. Ordered or unordered categorical outcomes may require ordinal or multinomial logistic regression.
Send us your research questions, variables, and dataset, and our statistical analysis experts will help you choose the correct regression model before you run the wrong analysis. If you are working on a dissertation, thesis, research paper, or data analysis project, contact StatisticalAnalysisHelp.com for professional statistical data analysis support.