Quantitative Data Analysis
Quantitative Data Analysis Help for Dissertations, Theses, and Research Quantitative data analysis often becomes the hardest part of a study when the data are ready, but the correct method, interpretation, and reporting still feel uncertain. Many students and researchers do not struggle because they lack effort. They struggle because the analysis stage demands precision at […]
Quantitative Data Analysis Help for Dissertations, Theses, and Research
Quantitative data analysis often becomes the hardest part of a study when the data are ready, but the correct method, interpretation, and reporting still feel uncertain. Many students and researchers do not struggle because they lack effort. They struggle because the analysis stage demands precision at every step. Variables must be coded correctly. Assumptions must be checked. Statistical tests must match the research questions. Results must be interpreted honestly. Then the findings must be written in a way that sounds clear, academic, and convincing. When one part breaks down, the whole results section starts to feel weak.
Quantitative Data Analysis Help That Turns Raw Data Into Clear Findings
A good dataset does not automatically produce a strong chapter, article, or report. Many projects stall after data collection because the next stage is more demanding than expected. The issue may begin with uncertainty about the right test. It may continue with missing values, outliers, weak variable coding, or confusion about what the software output actually means.
That is why strong support matters at this stage. Quantitative work is not only about generating tables. It is about building a defensible line of evidence from numerical data. The method has to fit the design. The output has to answer the research questions. The interpretation has to make academic sense.
Researchers in health, education, psychology, business, and the social sciences are expected to report methods and results transparently because statistical quality affects how trustworthy the findings appear. Reporting frameworks such as STROBE and CONSORT reflect that expectation.
For that reason, quantitative data analysis is not a minor technical task. It is one of the main parts of the research argument.
What Quantitative Data Analysis Really Involves
At its core, quantitative analysis uses numerical data to answer questions, test hypotheses, compare groups, measure relationships, and estimate effects. In practice, however, the process is layered.
It usually begins with data preparation. Variables are reviewed. Labels are checked. Missing values are examined. Scale items may need reverse coding. Outliers may need investigation. Only after the data are organized properly does the analysis move toward descriptive statistics and inferential testing.
Then comes method selection. A study comparing groups does not follow the same logic as a study predicting an outcome. A questionnaire-based project may require reliability analysis before regression or hypothesis testing can begin. A categorical outcome may point toward logistic regression rather than linear regression.
After that, interpretation becomes critical. Statistical significance alone is not enough. The American Statistical Association has emphasized that p-values do not measure the size or practical importance of an effect and should not be treated as a substitute for sound reasoning.
This is why quantitative data analysis needs both technical accuracy and academic judgment. Good work in this area shows not only what the numbers say, but what they mean in the context of the study.
The Problems Most Researchers Face at the Analysis Stage
The analysis stage often feels difficult because several decisions have to be made at once. Most users are not dealing with one single obstacle. They are dealing with a chain of connected tasks.
Some are unsure which statistical procedure fits their question. Others know the test but are not confident about the assumptions. Some already have output but cannot turn it into a clear results section. Others suspect that the data were not prepared correctly and worry that the final results may be misleading.
Common difficulties include:
- choosing the wrong test for the variable structure
- cleaning and coding the dataset properly
- handling missing values and outliers
- checking assumptions before the main analysis
- interpreting coefficients, odds ratios, and effect sizes
- presenting findings in APA or university-approved style
- responding to supervisor or examiner comments
These are not small issues. Even strong studies can look weak when the analysis chapter lacks structure, logic, or clarity.
Choosing the Correct Statistical Test Is Often the First Major Obstacle
One of the most common reasons researchers seek help is uncertainty about test selection. The topic may be clear, yet the method still feels uncertain.
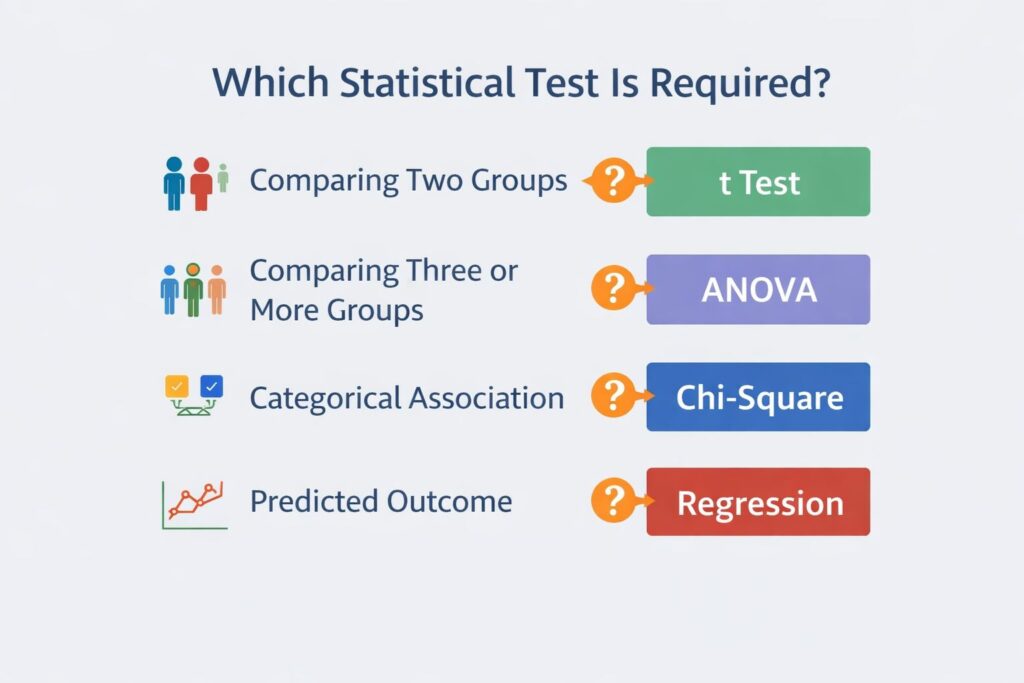
Comparing two groups may call for a t test, while comparing three or more groups may point to ANOVA. Examining association between categorical variables may require chi-square. Predicting an outcome may require regression. A binary outcome may lead to logistic regression. Questionnaire studies may need reliability analysis before any main inferential procedure is run.
These decisions sound straightforward when described in isolation. They become more difficult when a project includes several variables, multiple hypotheses, grouped data, or survey scales built from many items. That is why many researchers first need clarity on the broader statistical logic before moving into software output.
If the main challenge is identifying the right inferential path, related support can begin through Inferential Statistics Help, Hypothesis Testing Help, or Regression Analysis Help, depending on the structure of the study.
Data Preparation Can Strengthen or Weaken the Entire Study
A dataset can appear complete and still contain problems that distort the analysis. Categorical variables may be coded inconsistently. Numeric values may include impossible entries. Scale items may not be aligned. Duplicates may be present. Missing data may be treated too casually. Outliers may affect means, standard deviations, correlations, and model estimates.
This stage is often underestimated. Yet it affects everything that follows. Poor preparation can create misleading descriptive statistics, unstable regression estimates, and weak interpretation.
Missing data deserves particular care. Research on missing-data practice shows that simplistic case deletion can lead to biased estimates or unnecessary loss of information, while more principled approaches such as multiple imputation can perform better when used appropriately.
That is one reason some projects need data preparation before they need advanced testing. Researchers still working through that stage often benefit from Data Analysis Help, or from supporting resources such as How to Clean Data in Excel, How to Clean Data in R, and How to Clean Data in Python.
Interpretation Is Where Many Results Chapters Lose Strength
Many students can run software commands. Fewer can explain the output clearly and confidently.
A results table may show a significant difference, but the reader still needs to know which group scored higher and why that matters. A regression coefficient may be negative, but it still needs direction, meaning, and context. A logistic regression model may be significant overall, but the practical meaning of the odds ratio must still be explained.
Without interpretation, output remains incomplete. Reviewers, supervisors, and examiners do not only want to see the numbers. They want to see whether the researcher understands them.
This is why interpretation support is often just as important as the analysis itself. Resources such as How to Interpret SPSS Output, How to Report T-Test Results in APA Style, How to Report ANOVA Results in APA Style, and How to Report Regression Results in APA Format naturally fit into this stage of the workflow.
Quantitative Data Analysis Help Is Most Valuable When the Study Must Be Defensible
The real value of expert support is not only speed. It is defensibility.
A strong analysis can withstand questions such as:
- Why was this test chosen instead of another one?
- Were the assumptions checked before interpreting the findings?
- How were missing values handled?
- Were the scale items reliable enough for the next stage of analysis?
- What does the coefficient actually mean in the context of the study?
- Do the reported results answer the hypotheses directly?
These questions matter because a dissertation, thesis, article, or assignment is judged on reasoning as much as output. A chapter can include many tables and still feel weak if the logic is not clear. On the other hand, a well-structured analysis section often feels stronger even when the findings are modest, because the process is transparent and academically sound.
That is why many users move from broad Research Statistics Help into more focused support once the study design and variables are understood.
Quantitative Data Analysis for Dissertation and Thesis Research
Dissertation and thesis projects often require the highest level of support because the statistical work has to fit the larger structure of the study. The analysis chapter is not judged on isolated tests alone. It is judged on coherence.
The findings need to connect to the objectives, research questions, hypotheses, conceptual framework, and later discussion. If those parts do not align, the chapter may appear fragmented even when the tests themselves are technically correct.
Many postgraduate studies also involve multiple stages of analysis. There may be descriptive summaries, reliability analysis, assumption checks, hypothesis testing, and final models, all within the same chapter. That complexity is one reason dissertation-level work often needs more than simple software assistance.
For students writing a thesis or dissertation, targeted support often starts with Dissertation Data Analysis Help or Help With Dissertation Statistics. These options are especially useful when the project has moved beyond data collection and now requires a full statistical path from preparation to write-up.
Quantitative Data Analysis for Coursework and Assignments
Coursework projects are usually smaller, but they still demand accuracy. Students often need help with one specific stage rather than the full research process.
The challenge may be selecting the correct test, running SPSS or STATA properly, understanding the meaning of the output, or writing a short results section that meets the lecturer’s requirements. Even when the analysis is simpler than dissertation work, the consequences of weak method choice or poor interpretation can still lower grades.
This is where focused academic support becomes practical. Students may need Statistics Help for Students when the main issue is choosing and explaining the correct test. Others may need SPSS Help for Students or STATA Assignment Help when the method is already known but the software process remains confusing.
The goal is always the same: accurate analysis, clearer interpretation, and better academic presentation.
Quantitative Data Analysis Across Different Software Platforms
Software matters, but it is never the whole story. Good analysis depends on the reasoning behind the commands.
Still, software-specific support is often necessary because many users know the method in theory but struggle with implementation. Some work in SPSS because it fits coursework or dissertation requirements. Others use R for flexibility and reproducibility. Some prefer STATA for econometrics, public health, or panel-data workflows.
Common needs include:
- importing and structuring data
- recoding variables
- generating composite scores
- running descriptive and inferential procedures
- checking assumptions and diagnostics
- exporting tables and results for reporting
For SPSS-based projects, SPSS Analysis Help is often the best fit when the workflow includes cleaning, testing, interpretation, and results presentation. For R-based work, RStudio Homework Help supports users who need both code-level and analytical guidance.
Core Components of Strong Quantitative Data Analysis
The strongest projects usually share the same core features. These components create a results section that feels rigorous, readable, and credible.
| Component | Why it matters |
|---|---|
| Clear research question alignment | Keeps the statistical method tied to the study aim |
| Accurate variable classification | Prevents mismatch between data type and test |
| Careful data screening | Reduces coding errors, duplication, and misleading values |
| Reliability or scale checks | Strengthens questionnaire-based analysis |
| Descriptive statistics | Helps readers understand the sample and early patterns |
| Assumption testing | Protects the validity of inferential conclusions |
| Appropriate model selection | Ensures the method fits the data structure |
| Clear interpretation | Turns numbers into meaningful findings |
| Transparent reporting | Makes the work easier to review and defend |
When one of these parts is skipped, the later stages usually become harder. A weak start often leads to weak interpretation.
Quantitative Data Analysis Help With Survey and Likert-Scale Projects
Survey research is one of the most common areas where statistical confusion appears. Many surveys use multiple items to measure the same construct, which means the analysis has to address both the items and the overall scale.
Before the main hypotheses are tested, the data may need:
- item screening
- reverse coding
- scale construction
- reliability testing
- descriptive summaries
- group comparisons or predictive modelling
Likert-scale data also create frequent questions. Researchers often ask whether means are appropriate, whether nonparametric tests are needed, or whether scale scores can be used in regression. The right answer depends on the structure of the study, the number of items, the quality of the scale, and the expectations of the field.
Support in this area often connects with How to Analyze Survey Data and How to Analyze Likert Scale Data, especially when the project needs a coherent route from raw responses to final interpretation.
Assumption Checks Matter More Than Many Users Realize
A statistical model can look impressive and still be weak if its assumptions are ignored. This is one of the main ways analysis chapters lose credibility.
Regression work, for example, often requires attention to multicollinearity, linearity, homoscedasticity, and influential observations. Group comparison studies may need normality-related checks and attention to variance structure. Diagnostic work is not a decorative extra. It shapes how the results should be interpreted.
In the literature, methodological guidance consistently emphasizes that assumptions are tied to inference quality. Ignoring them can produce unstable coefficients, misleading significance tests, or overly confident conclusions.
For this reason, researchers working with models often need dedicated support around Linear Regression Assumptions and How to Check for Multicollinearity before they can write the results with confidence.
Benefits of Expert Quantitative Data Analysis Help
One major benefit is clarity. Complex decisions become easier when they are handled in a logical sequence rather than through guesswork.
Another benefit is methodological accuracy. Choosing the correct test early saves time and reduces the risk of major revisions later. This is especially valuable in dissertation and thesis work, where one weak decision can affect multiple sections of the chapter.
A third benefit is cleaner interpretation. Many users already have the output. What they need is a way to explain the findings in academic language that sounds confident, precise, and relevant to the study.
A fourth benefit is stronger reporting. Well-organized tables, coherent paragraph structure, and consistent interpretation make the final work easier to read. That matters in marked assignments, dissertations, institutional reports, and journal manuscripts.
A fifth benefit is revision readiness. When the workflow is clear and well documented, it becomes much easier to respond to supervisor feedback or examiner questions.
What Strong Reporting Looks Like in Quantitative Data Analysis
A strong quantitative write-up does more than restate numbers. It guides the reader through the evidence.
The descriptive section should show who participated in the study and how the main variables are distributed. The inferential section should move directly from the research question to the appropriate result. Interpretation should explain the direction of the finding, the strength of the relationship or difference, and the meaning of the result in plain academic language.
Where appropriate, reporting should also acknowledge effect size, confidence intervals, or model quality rather than relying on p-values alone. This is consistent with major statistical guidance, which emphasizes fuller interpretation over threshold-based reporting.
In dissertation work, this often means turning raw output into a structured chapter. That is where How to Write Chapter 4 Results and Discussion becomes especially relevant.
Quantitative Data Analysis Help With Regression and Predictive Models
Regression is one of the most common areas where students and researchers need support because it combines several layers of reasoning.
The researcher must identify dependent and independent variables correctly. The data must meet reasonable assumptions. Multicollinearity has to be checked. Coefficients need careful interpretation. The overall model must be reported clearly. In logistic regression, odds ratios also need to be explained in a way that makes sense to the reader.
Many projects reach this stage after descriptive statistics and correlation are complete. At that point, the challenge is not just running the model. It is making sure the model is appropriate and the findings are not overstated.
If the study includes continuous outcomes, Regression Analysis Help is often the natural next step. If the outcome is binary, Logistic Regression Help can provide the more targeted support needed for model choice, interpretation, and reporting.
Quantitative Data Analysis Help With Outliers and Difficult Data Patterns
Some datasets include values that do not fit the general pattern. These may be valid extreme cases, data-entry mistakes, or meaningful observations that require careful interpretation.
Outliers can affect means, standard deviations, correlation coefficients, and regression slopes. They can make a relationship appear stronger or weaker than it really is. Yet removing them automatically is not always the right decision. The correct response depends on whether the unusual value is valid, erroneous, or influential enough to distort the analysis.
This is one reason outlier handling should be documented carefully. Researchers often need support deciding whether to retain, correct, transform, or exclude unusual cases. That process is stronger when it is transparent and defensible.
For work at this stage, How to Deal with Outliers in Data Analysis fits naturally into the workflow.
Ethical Standards in Quantitative Data Analysis
Ethics matters in statistical work because the analysis chapter often determines how the evidence will be perceived.
Ethical support means working with real data, using methods that fit the study, checking assumptions honestly, and reporting findings without exaggeration. It means being willing to say when results are mixed, weak, or non-significant rather than forcing a stronger story than the data can support.
This approach aligns with the broader direction of research reporting guidance. Transparent methodology and honest interpretation are central to credible research practice.
Academic support in quantitative data analysis should therefore improve understanding and presentation, not replace integrity.
How to Recognize High-Quality Quantitative Data Analysis Help
Not all support offers the same depth. Some options focus only on running commands. Others provide general tutoring but little methodological review. Stronger support combines statistical reasoning, software competence, and academic writing skill.
Useful signs of quality include:
- clear explanation of why a method is appropriate
- willingness to review research questions and hypotheses first
- attention to data quality before testing
- support with assumptions and diagnostics
- clear interpretation in academic language
- readiness to revise after feedback
- ethical boundaries around real data and honest reporting
A strong fit should help the work become more defensible, not more confusing.
Frequently Asked Questions
What is quantitative data analysis?
Quantitative data analysis is the process of using numerical data to answer research questions, test hypotheses, compare groups, study relationships, and estimate effects through statistical methods.
Can help include choosing the correct statistical test?
Yes. Many researchers need support matching the research design, variables, and hypotheses to the most suitable statistical procedure before the main analysis begins.
Do you only support SPSS projects?
No. Support can involve SPSS, R, STATA, and related statistical workflows. The key focus is not the software alone, but the quality of the method, interpretation, and final reporting.
Can dissertation Chapter 4 be supported?
Yes. Many dissertation writers need help moving from raw output to a well-structured results chapter that includes tables, interpretation, and alignment with the research questions.
What if supervisor feedback has already been received?
That is common. Existing work can be reviewed, clarified, corrected, and strengthened so the revised version responds more effectively to the comments.
Is this type of help ethical?
Yes, when it supports real analysis, real interpretation, and honest reporting. Ethical support does not involve fabricated data, invented output, or misleading claims.
Final Thoughts on Quantitative Data Analysis
Strong quantitative data analysis is one of the clearest signs of research quality. It shows whether the study design, variables, methods, and evidence actually fit together.
Many students and researchers reach the analysis stage with useful data and clear motivation, yet still feel stuck because the statistical path remains uncertain. They may have output without interpretation, methods without confidence, or draft results that still feel too thin. That is exactly where expert support can make a meaningful difference.
Good analysis creates more than numbers. It creates clarity, strengthens the structure of the results chapter, improves reporting quality, and makes revision easier.Most importantly, it helps the final work stand on stronger academic ground.
Get Expert Help With Quantitative Data Analysis
When the data are ready but the next step still feels unclear, this is the right stage to strengthen the work. Support can cover method selection, data screening, assumption testing, modelling, interpretation, and final reporting, depending on what the project needs most.
Whether the need is broad Data Analysis Help, focused Dissertation Data Analysis Help, software-specific SPSS Analysis Help, student-focused Statistics Help for Students, or more advanced Research Statistics Help, the aim remains the same: accurate methods, clear findings, and stronger academic writing.
If your project has reached the stage where the data exist but the results are still not where they need to be, Request Quotes Now and get expert support with your quantitative data analysis.