Linear Regression Assumptions
Linear regression is one of the most widely used statistical methods in dissertations, theses, assignments, and research projects because it helps explain how one or more independent variables relate to a continuous outcome. It is common in education, business, psychology, health research, economics, and social science. However, running a regression model is only one part of the work. Before the results can be trusted, the model must be checked carefully.
That is why understanding linear regression assumptions is so important. Many students know how to enter variables into SPSS, R, STATA, or Excel, but become less confident when they need to test assumptions, interpret diagnostic output, and report the findings clearly in Chapter 4. A regression table may look complete, but if the assumptions are violated and not handled properly, the conclusions may become weak, misleading, or difficult to defend.
At Statistical Analysis Help, this is one of the most common areas where students and researchers need support. Some already have regression output but are unsure whether the model is valid. Others are still preparing the results chapter and want to know what diagnostic checks should be reported. If you need broader support, our Regression Analysis Help and Data Analysis Help pages explain how we support quantitative research from model selection to final interpretation. If your work is part of a thesis or doctoral study, our Dissertation Data Analysis Help and Help With Dissertation Statistics pages are also highly relevant.
What Linear Regression Assumptions Mean
Linear regression assumptions are the conditions that help make the model appropriate, interpretable, and statistically reliable. These assumptions do not mean that the data must be perfect. They mean that the regression model should behave in a way that allows the coefficients, standard errors, p values, and confidence intervals to be interpreted reasonably well.
When the assumptions are met, the regression findings become much easier to trust. When they are violated, the model may exaggerate relationships, weaken significance tests, or create unstable coefficients. That is why assumption testing is not an optional add-on. It is part of the quality of the regression analysis itself.
Table 1: Main Linear Regression Assumptions
| Assumption | Meaning | Why It Matters |
|---|---|---|
| Linearity | Predictors should relate to the outcome in a roughly straight-line way | A curved relationship can make the linear model inaccurate |
| Independence of errors | Residuals should not be related to one another | Dependence can distort standard errors and tests |
| Homoscedasticity | Residuals should show roughly constant variance | Unequal spread can affect significance testing |
| Normality of residuals | Residuals should be approximately normally distributed | This supports inference and interpretation |
| No severe multicollinearity | Predictors should not overlap too strongly | High overlap makes coefficients unstable |
Why Linear Regression Assumptions Matter
In academic research, regression is often used to answer important questions about prediction and influence. A researcher may want to know whether study habits predict academic performance, whether marketing quality predicts customer satisfaction, or whether access to healthcare predicts patient outcomes. These questions are meaningful, but the findings become much stronger only when the model is appropriate for the data.
If assumptions are ignored, the results may still appear convincing on the surface while hiding major problems underneath. A coefficient may look significant even when the model fit is weak. Standard errors may become unreliable if the variance of residuals is not constant. Predictors may appear unstable if multicollinearity is high. For this reason, a strong dissertation or research report does not simply present coefficients and p values. It also shows that the regression assumptions were checked properly.
Assumption 1: Linearity
The linearity assumption means that the relationship between each predictor and the dependent variable should be approximately linear. In simple terms, changes in the predictor should be associated with changes in the outcome in a roughly straight-line pattern rather than a clearly curved one.
This does not mean every real-world relationship must be perfectly straight. It means the linear regression model should be a reasonable summary of the pattern in the data. If the true pattern is strongly curved, a basic linear model may not represent the relationship well.
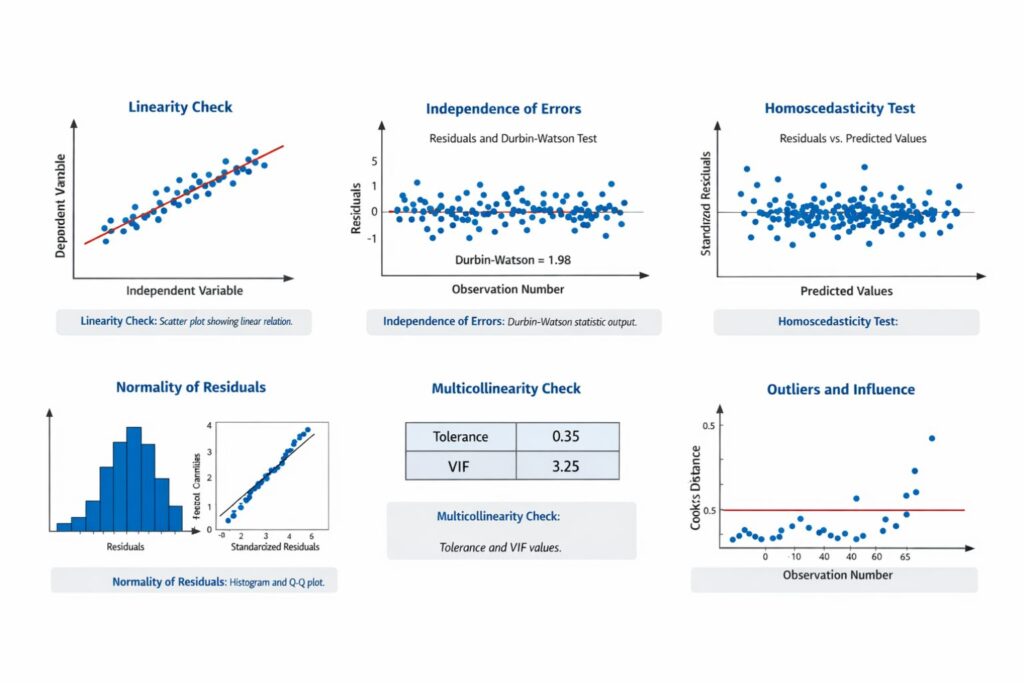
Researchers often check linearity using scatterplots, partial regression plots, or residual plots. If the pattern suggests a straight trend, the assumption is usually considered acceptable. If the evidence shows strong curvature, the researcher may need to transform variables, add polynomial terms, or consider a different model.
Table 2: How to Check Linearity
| What to Check | Common Tool | What Supports the Assumption |
|---|---|---|
| Relationship between predictor and outcome | Scatterplot | A roughly straight trend |
| Pattern after controlling for other variables | Partial regression plot | No clear curve |
| Overall model pattern | Residual plot | No systematic curvature |
Assumption 2: Independence of Errors
The independence assumption means that the residuals, or errors, should not be correlated with one another. This is especially important in time series data, repeated measures, longitudinal designs, or ordered observations where one case may influence the next.
In many cross-sectional studies, independence is often supported by the research design itself because each participant contributes only one observation. A common diagnostic statistic is the Durbin-Watson value. In many practical settings, a value close to 2 suggests that autocorrelation is not a major concern.
This assumption is often reported briefly in Chapter 4 by stating that the Durbin-Watson statistic supported independence of errors or that the study design involved independent observations. If you are using SPSS for this stage, our SPSS Analysis Help page can support both the diagnostics and the reporting.
Table 3: Interpreting Independence of Errors
| Diagnostic | Purpose | General Interpretation |
|---|---|---|
| Durbin-Watson | Checks autocorrelation in residuals | A value near 2 often suggests independence |
| Study design review | Confirms whether observations are independent | One response per participant often supports independence |
Assumption 3: Homoscedasticity
Homoscedasticity means that the residuals should have roughly constant variance across the range of predicted values. In a good regression model, the spread of residuals should remain relatively even rather than becoming wider or narrower as the fitted values increase.
When this assumption is violated, the model may show heteroscedasticity. That means the error variance changes across the fitted values. This can make standard errors less reliable and reduce confidence in significance testing.
Researchers usually inspect a plot of standardized residuals against standardized predicted values. If the points are scattered randomly without a funnel shape, the assumption is often acceptable. If the spread widens or narrows clearly, heteroscedasticity may be present.
Table 4: Homoscedasticity Patterns
| Residual Pattern | Likely Meaning |
|---|---|
| Random and even spread | Homoscedasticity is likely acceptable |
| Funnel shape | Possible heteroscedasticity |
| Strong clustering or curve | Model may need further review |
Assumption 4: Normality of Residuals
The normality assumption refers to the residuals rather than the raw variables themselves. Many students incorrectly assume that every variable in the model must be perfectly normal. In practice, the more important issue is whether the residuals are approximately normally distributed, especially when significance testing and confidence intervals are being interpreted.
Residual normality can be assessed using histograms, Q-Q plots, or normal probability plots. Small deviations from normality are common and do not automatically invalidate the model, especially in larger samples. The main issue is whether the departure is serious enough to affect the analysis.
A strong write-up usually states that the residuals were examined visually and found to be approximately normal. Students who need help understanding this step rather than just running it may also benefit from Statistics Help for Students.
Table 5: Checking Normality of Residuals
| Tool | What to Look For | What It Suggests |
|---|---|---|
| Histogram of residuals | Rough bell shape | Approximate normality |
| Q-Q plot | Points close to diagonal line | Residuals are reasonably normal |
| Normal probability plot | No strong systematic departure | Normality assumption supported |
Assumption 5: Absence of Multicollinearity
Multicollinearity occurs when independent variables are too strongly correlated with one another. Some overlap between predictors is normal, but severe overlap can make regression coefficients unstable, inflate standard errors, and make interpretation much more difficult.
Researchers commonly assess multicollinearity using tolerance values and variance inflation factor, known as VIF. Very low tolerance values and high VIF values suggest a stronger multicollinearity problem. Correlation matrices can also provide an early warning when predictors are highly related.
This assumption matters because a predictor may appear unimportant not because it truly lacks influence, but because its effect overlaps heavily with another predictor in the model. If you are analyzing this in R or STATA, our RStudio Homework Help and STATA Assignment Help pages can support software-specific testing and reporting.
Table 6: Multicollinearity Diagnostics
| Diagnostic | Meaning | General Interpretation |
|---|---|---|
| Tolerance | Unique variance left in the predictor | Very low values suggest a problem |
| VIF | Inflation caused by overlap with other predictors | Higher values suggest stronger multicollinearity |
| Correlation matrix | Relationship among predictors | Very high correlations may indicate concern |
Outliers and Influential Cases
Although outliers and influential observations are sometimes discussed separately from the core assumptions, they are extremely important in regression analysis. A few unusual cases can strongly affect the regression line, change the coefficients, and alter the interpretation of the model.
Researchers often inspect standardized residuals, leverage values, and Cook’s distance to identify unusual or influential cases. The correct response is not to remove cases automatically. Instead, each unusual case should be reviewed carefully to determine whether it reflects data entry error, a valid extreme observation, or a case with strong influence on the model.
A strong dissertation or report explains clearly whether such cases were found and how they were handled.
Table 7: Outlier and Influence Diagnostics
| Diagnostic | Purpose | Helps Identify |
|---|---|---|
| Standardized residuals | Detect unusual prediction errors | Possible outliers |
| Leverage | Detect unusual predictor patterns | Cases with unusual predictor values |
| Cook’s distance | Detect influential observations | Cases that strongly affect the model |
How to Check Linear Regression Assumptions Step by Step
A clear sequence makes assumption testing easier. Start with scatterplots to examine linearity. Then review residual plots to assess homoscedasticity. Next, inspect a histogram and Q-Q plot to assess residual normality. After that, check tolerance and VIF values for multicollinearity. Then review the Durbin-Watson statistic or the study design to assess independence. Finally, inspect outlier and influence diagnostics such as Cook’s distance.
Table 8: Step-by-Step Guide to Checking Assumptions
| Step | Assumption or Issue | Common Check |
|---|---|---|
| 1 | Linearity | Scatterplots, partial regression plots |
| 2 | Homoscedasticity | Residuals versus predicted values plot |
| 3 | Normality of residuals | Histogram, Q-Q plot |
| 4 | Multicollinearity | Tolerance, VIF |
| 5 | Independence of errors | Durbin-Watson, study design |
| 6 | Outliers and influence | Standardized residuals, leverage, Cook’s distance |
This order also makes the write-up easier because the diagnostics can be reported in a logical sequence instead of as disconnected pieces of output.
How to Report Linear Regression Assumptions in Chapter 4
One of the most common difficulties in regression analysis is not running the checks but writing them up clearly. Strong reporting should be concise, direct, and defensible. The goal is not to describe every step taken in the software. The goal is to show that the assumptions were checked and that the model was suitable for interpretation.
Table 9: Example of an Assumption Summary Table
| Assumption | Diagnostic Used | Result | Conclusion |
|---|---|---|---|
| Linearity | Scatterplots | Roughly straight patterns observed | Assumption met |
| Independence | Durbin-Watson | 1.94 | Assumption met |
| Homoscedasticity | Residual plot | No major funnel pattern | Assumption met |
| Normality | Histogram and Q-Q plot | Approximate normality observed | Assumption met |
| Multicollinearity | Tolerance and VIF | Tolerance above .20 and VIF below 5 | No severe multicollinearity |
| Influence | Cook’s distance | No highly influential cases detected | No serious influence concern |
A summary table like this strengthens the presentation of the regression model and makes the findings easier to defend. If you already have regression output but do not know how to write it up clearly, Request a Quote Now through Statistical Analysis Help.
Common Mistakes When Handling Linear Regression Assumptions
A common mistake is reporting regression coefficients without discussing assumptions at all. Another is confusing normality of variables with normality of residuals. Another is claiming that all assumptions were met without presenting any evidence or explanation.
Some researchers also overreact to minor imperfections in diagnostic plots and assume the model cannot be used. Real data is rarely flawless. A stronger academic approach is to identify what was checked, describe what was found, and explain whether any issue was serious enough to affect interpretation.
Table 10: Common Mistakes and Better Practice
| Common Mistake | Better Practice |
|---|---|
| Reporting coefficients without diagnostics | Check and report assumptions first |
| Confusing variable normality with residual normality | Focus on the residual diagnostics |
| Claiming assumptions were met without evidence | Show a brief summary of diagnostics |
| Removing outliers automatically | Investigate and justify any decision |
| Ignoring multicollinearity | Review tolerance and VIF before interpretation |
What to Do If an Assumption Is Violated
If one or more assumptions are violated, the next step depends on the type and severity of the problem. In some cases, the solution may involve transforming a variable. In others, the model may need additional terms, robust methods, or a different analytic approach. Outliers may need to be reviewed carefully, especially if they are errors or highly influential.
The strongest academic position is not to claim perfection. It is to show that the diagnostics were reviewed honestly and that any necessary response was justified clearly. This often makes a dissertation stronger because it shows methodological understanding rather than blind reliance on output.
Final Thoughts on Linear Regression Assumptions
Understanding linear regression assumptions is essential for strong statistical analysis. The value of a regression model does not depend only on the coefficients or significance levels. It also depends on whether the model is appropriate for the data and whether the diagnostics support the conclusions.
Strong regression work begins with a clear research question, continues through careful model building, and becomes defensible through assumption testing and transparent reporting. Whether you are using SPSS, R, STATA, or Excel, the principle remains the same: the model should be checked before the results are trusted.
If you need help with regression diagnostics, interpretation, dissertation reporting, or Chapter 4 writing, our Regression Analysis Help, Data Analysis Help, Dissertation Data Analysis Help, and Help With Dissertation Statistics pages are the best next steps.
FAQ: Linear Regression Assumptions
What are the main linear regression assumptions?
The main assumptions are linearity, independence of errors, homoscedasticity, normality of residuals, and absence of severe multicollinearity. Researchers also often examine outliers and influential cases.
Why are linear regression assumptions important?
They help show whether the model is appropriate for the data and whether the coefficients, standard errors, and significance tests can be interpreted with confidence.
Does linear regression require all variables to be normally distributed?
No. The more important issue is whether the residuals are approximately normally distributed, especially when inference is involved.
How do I test linearity in regression?
Linearity is often checked using scatterplots, partial regression plots, or residual plots to see whether the relationship is approximately straight.
What is homoscedasticity in linear regression?
Homoscedasticity means that the spread of residuals remains relatively constant across the range of predicted values.
How do I know if multicollinearity is a problem?
Tolerance and VIF values are commonly used. Strong overlap among predictors can make coefficients unstable and harder to interpret.
What happens if a regression assumption is violated?
The response depends on the issue. The researcher may transform variables, revise the model, use robust methods, or consider a different analysis.
How do I report regression assumptions in a dissertation?
Report what diagnostics were used, what the results suggested, and whether the model was considered suitable for interpretation.
Can I run regression in SPSS and still fail the assumptions?
Yes. Running the regression does not guarantee that the assumptions are met. The diagnostics still need to be checked and interpreted properly.
Where can I get help with linear regression assumptions?
You can get support from Statistical Analysis Help with regression diagnostics, interpretation, Chapter 4 writing, and dissertation-level reporting.